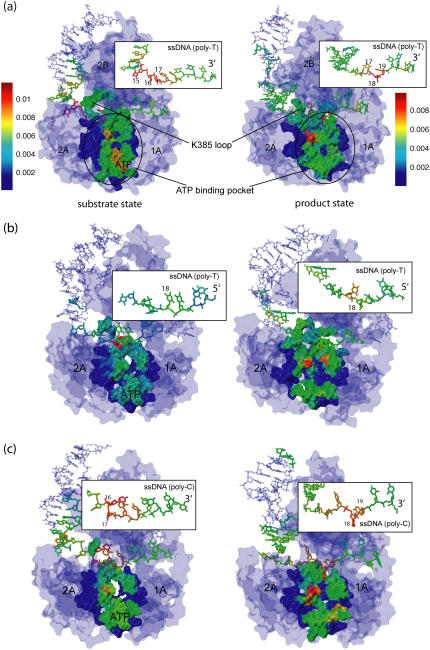
FIGURE 5.
Dynamical coupling analysis based on an elastic network model (25,26) for the PcrA-DNA complex. In this analysis, dynamic coupling is probed (27) through perturbation of a residue's spring constant and monitoring through a low-pass filter (i.e., accounting only for low-frequency modes) the ensuing effect on the vibrational fluctuation 〈δr2〉 of the ATP binding site. The analysis was carried out for complexes in the substrate (ATP bound) and product (no ATP/ADP bound) state of the original system (a) (from (11)), the system with the DNA polarity reversed (b), and the system with poly-T ssDNA changed to poly-C (c). The PcrA-DNA complexes are colored according to the magnitude of dynamical coupling of residues to the fluctuations of the ATP binding pocket in both states. The protein, DNA, and ATP are shown in surface, licorice, and vdW representations, respectively. The inserts zoom into the ssDNA region showing the dynamical coupling of the ssDNA segment to the ATP binding pocket for each complex. In the original system (a) with a 3′ poly-T ssDNA bound to the PcrA, it can be recognized that the coupling is higher in the left region (nucleotides 15–17) of the ssDNA segment in the substrate state, whereas the coupling is higher in the right region (nucleotides 18 and 19) of the ssDNA segment in the product state; the pattern disappears in the system with a 5′ poly-T ssDNA bound to the PcrA (b), whereas the pattern is retained in the system with a 3′ poly-C ssDNA bound (c).

