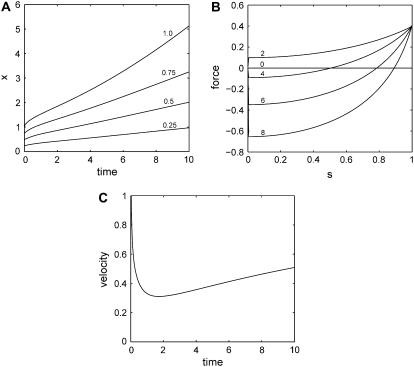
FIGURE 2.
Generic behavior at constant proliferation rate. Here  and
and  (A) Graphs of the position x of cells with s = 0.25, 0.5, 0.75, 1 as a function of time (in hours). (B) Resultant force f in the layer versus position s for t = 0, 2, 4, 6, 8 h. (C) Velocity of the edge as a function of time (in hours).

