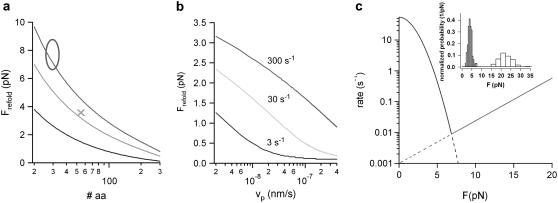
FIGURE 5.
A minimal model prediction for protein folding forces. (a) Average calculated refolding forces as a function of the number of folding amino acids. The average folding force was calculated at three different zero-force refolding rates of 3 s−1 (black), 30 s−1 (light gray), and 300 s−1 (gray) using a pulling velocity of vP = 5 nm/s and a spacer of the length L0 = 150 nm. (x) Average refolding force of ddFLN4 from the unfolded to the intermediate state. (o) The range of refolding forces observed for ankyrin taken from Lee et al. (4). (b) Average refolding force of a 100-amino-acids protein calculated for three different zero-force folding rates (color code as in panel a) as a function of the pulling velocity with a polypeptide spacer of L0 = 150 nm. (c) Calculated folding and unfolding rate (black and gray line, respectively) for the transitions between the unfolded and the intermediate state of ddFLN4 as a function of the external force. The folding rate was calculated following Eq. 3. The unfolding rate parameters were extracted from a Bell equation fit to the unfolding force distribution (gray bars) shown in the inset. The intersection of both functions reveals an equilibrium force of ∼7 pN.

