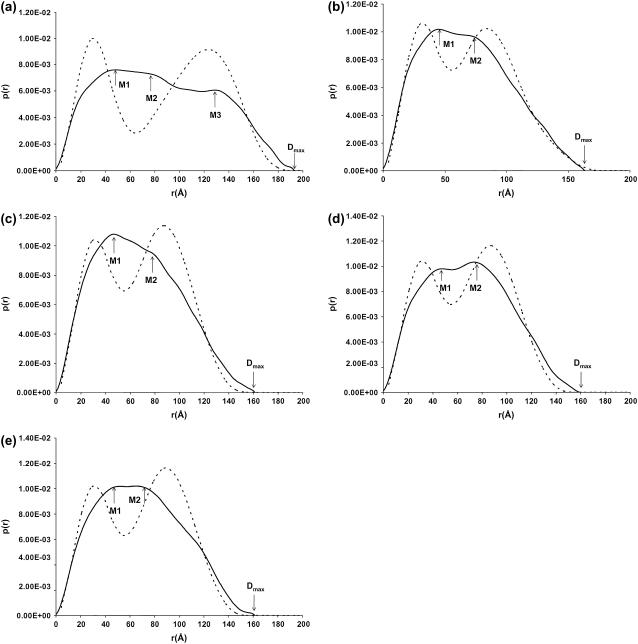
FIGURE 4.
Superimposition of the experimental (—) with the calculated p(r) plots (- - -) from bead modeling. (a) Wild-type IgG3; (b) IgG3m15; (c) IgG3HM5; (d) wild-type IgG4; and (e) IgG4S331P. In panel a, SAXS peaks M1, M2, and M3 occur at ∼46 Å, 83 Å, and 129 Å, respectively. The experimental maximum dimension of ∼195 Å is denoted as Dmax. In panels b–e, M1 occurs at ∼46 Å and M2 at 76–80 Å, respectively. For Dmax values, see Table 2.

