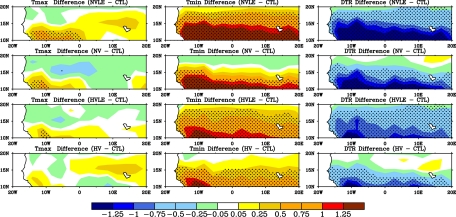
Fig. 3.
Spatial patterns of simulated annual mean temperature differences (°C) between the four experiments (NVLE, NV, HVLE, and HV) and the control run (CTL) under clear-sky conditions in the Sahel. Daily averaged low cloud fraction <20% is defined as clear-sky conditions. Stippling shows grid cells where the temperature differences are statistically significant at the 5% level. A two-tailed Student's t test was used to test whether the difference differs significantly from zero.

