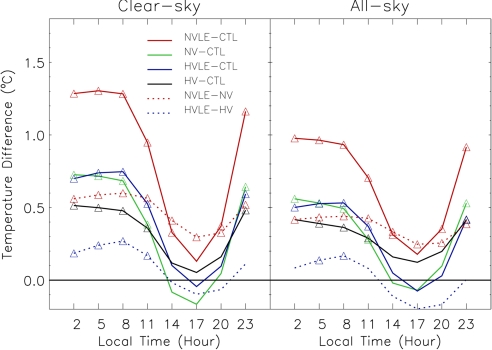
Fig. 4.
Diurnal cycle of simulated annual mean Tmax, Tmin, and DTR differences (°C) among the four experiments (NVLE, NV, HVLE, and HV) and the control run (CTL) under clear-sky (Left) and all-sky (Right) conditions averaged over the Sahel. The model outputs are 3-hr averages from each time step (20 min). The clear-sky conditions are defined as in Fig. 3. In the simulations, the Tmax occurs at about 5 p.m. and the Tmin at about 6 a.m. The differences marked with ▵ are statistically significant at the 5% level. The significance test was done as for Fig. 3.

