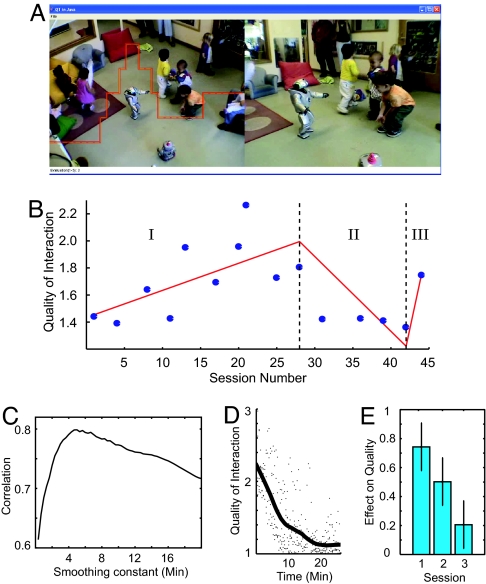
Fig. 1.
Analyses of the quality of interaction. (A) Coders operated a dial in real time to indicate their perception of the quality of the interaction between children and QRIO observed in the video. (B) Blue dots plot the average quality of interaction score on a random sample of 15 days. The red line represents a piece-wise-linked linear regression fit. The vertical dashed lines show the separations between phases. (C) Inter-observer reliability between four coders as a function of a low-pass-filter smoothing constant. (D and E) Main effects on the quality of interaction score as a function of time within a session (D) and across sessions (E).

