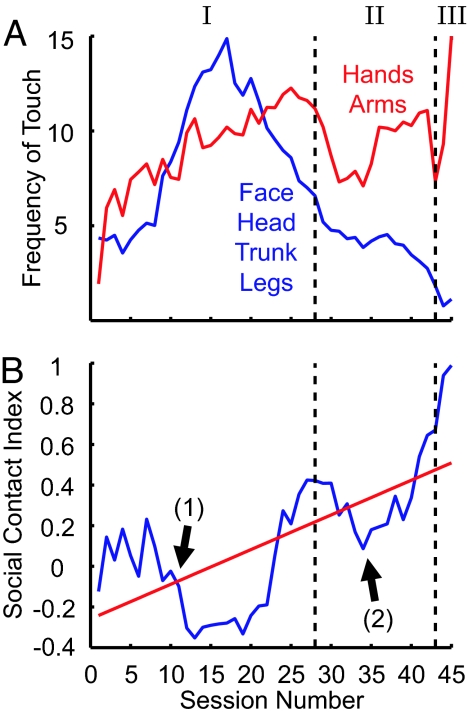
Fig. 2.
Analyses of the haptic behavior in children. (A) Evolution of the average frequency of touch on the robot's hands/arms (red) and face/head/trunk/legs (blue). (B) Correlation between the robot–child and the child–child touch distributions. Note that touch and giggling contingency was introduced at (1), and the first part of the repetitive dance experiment ended at (2). The vertical dashed lines show the separations between phases.

