Fig. 1.
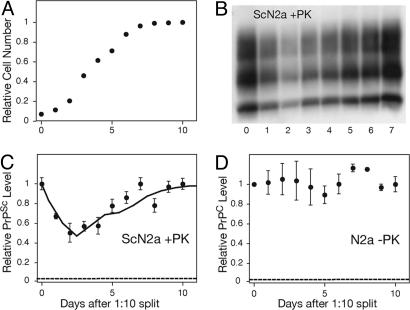
Cell division decreases the intracellular accumulation of PrPSc but not PrPC. (A) Growth curve for ScN2a cells after a 1:10 split in 100-mm plates. (B–D) The change in the accumulation of PrPSc in ScN2a (B and C) and PrPC in N2a (D) as cells progress from a logarithmic growth phase to stationary phase, as detected by Western blot (B) and ELISA (C and D). After lysis, all samples were normalized to 1 mg/ml total protein concentration as determined by the BCA assay (Pierce) before further processing. The plotted ELISA measurements were normalized to measurements at time 0. The dashed lines indicate the background signal level as determined by plating a mock PBS + 1% BSA sample. The error bars represent standard deviations of three replicate measurements. The solid line in C indicates the predicted PrPSc fluctuation based on the limited conversion model and Eq. 8 (SI Text).

