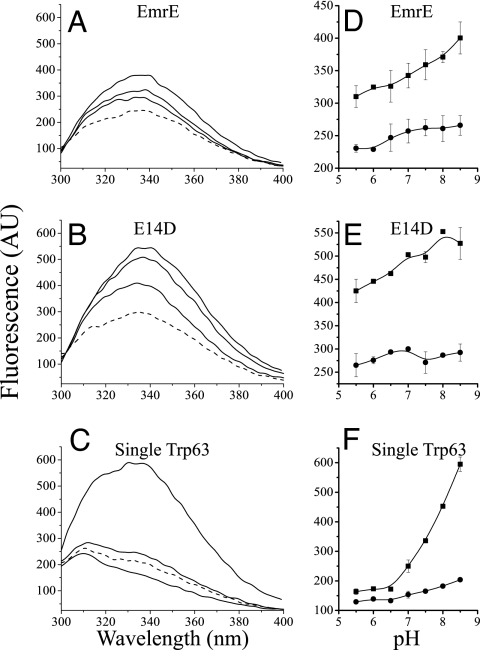
Fig. 1.
Tryptophan fluorescence spectra of EmrE mutants at different pH values with/without substrate. (A–C) Emission spectra (excitation at 280 nm) of 0.5 μM EmrE (A), 0.5 μM E14D (B), and 2 μM single Trp63 (C). The lowest solid line is at pH 5.5, the middle is at pH 7.0, and the highest is at pH 8.5. The dashed line represents protein at pH 8.5 after addition of 50 μM of the substrate TPP+. The shoulder at ≈310 nm in the spectra of the single Trp-63 mutant (that bears seven Tyr residues) is not observed upon excitation at 295 nm and was assigned to Tyr fluorescence (14). (D–F) Summary of the pH dependence of the fluorescence intensity at the emission peak at 338 nm of free (squares) and substrate-bound protein (circles).

