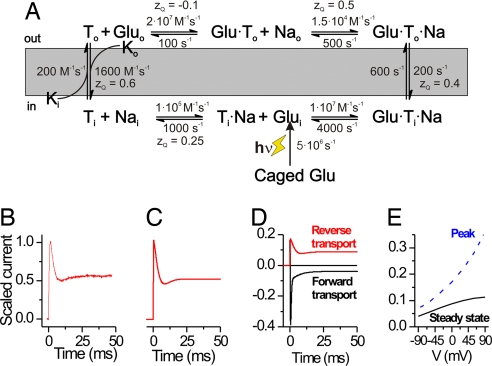
Fig. 6.
Kinetic scheme and numeric simulations of glutamate reverse and forward transport. A simple kinetic model based on a “first-in-first-out” mechanism can explain the experimental data (A). (B and C) Experimental reverse transport current (left trace, B), scaled to a peak amplitude of 1 is compared with results from numeric simulations (right trace, C) according to the scheme shown in A. (D) Simulation of reverse and forward transport current under conditions that match the experiments in Fig. 5B. (E) Simulated voltage dependence of the reverse transport current at the peak of the response and at steady state (data are shown in Fig. 4C).

