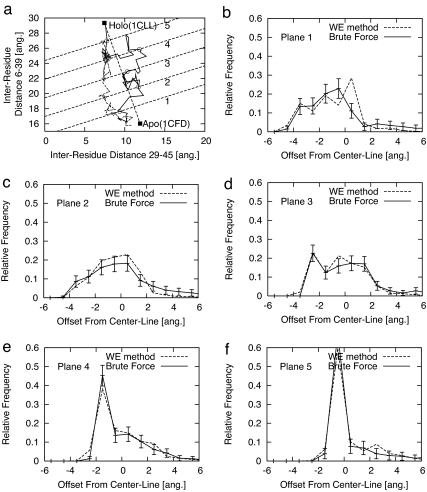
Fig. 4.
Structural distributions describing the heterogeneity of the path ensemble connecting the Apo and Holo states of calmodulin, based on both WE and brute-force simulations. a shows two sample Apo → Holo transitions, with open symbols indicating points at which the five parallel (dashed) “planes” are first crossed. Plots b–e show the ensemble-based distributions of the first crossing points of the paths on each of the five planes from a.

