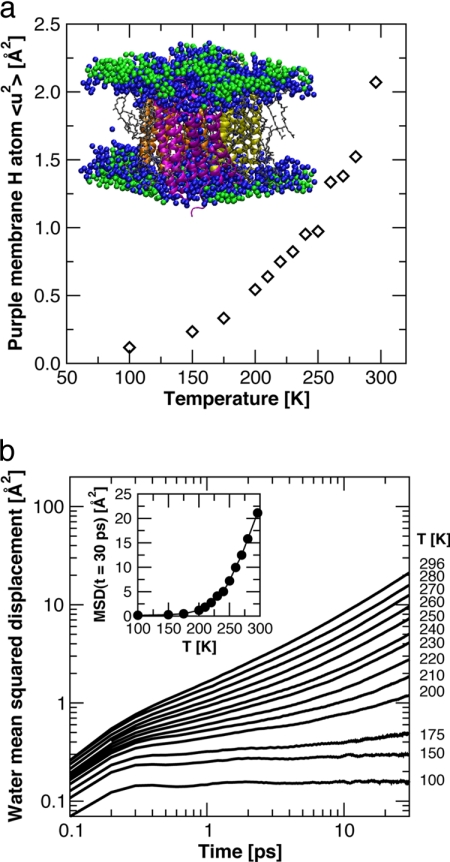
Fig. 3.
Molecular dynamics simulation data. (a) Temperature-dependence of the mean square displacements of the nonexchangeable hydrogen atoms of the protein and lipid molecules computed from the MD simulation trajectories. Each point represents an average over 5 ns. The Inset shows a snapshot of the unit cell from one of the simulations, with the three BR monomers colored magenta, orange, and yellow, the lipid molecules gray, the water molecules in the first solvation shell (defined as within 4 Å of a heavy atom (42), taking periodic boundary conditions into consideration) of protein and/or lipid molecules blue, and the remaining water molecules green. (b) Time-evolution of the MSDs of centers-of-mass of water molecules in the first solvation shell (colored blue in a), averaged over water molecules and time origins. The Inset plots the values of the MSDs at t = 30 ps versus temperature. A dynamical transition is evident at ≈200 K.

