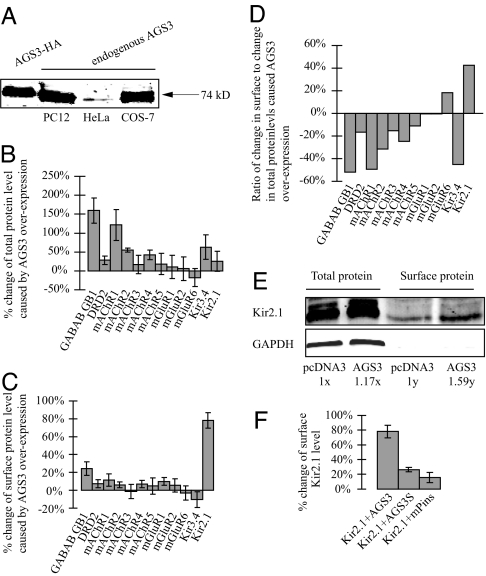
Fig. 1.
The effects of overexpressing AGS3 or mPins on the surface and total protein levels of receptors and channels. (A) An antibody against AGS3 (CalBiochem) recognized a 74-kDa band from HeLa and COS7 lysates. Lysates from COS7 cells overexpressing an HA-tagged AGS3 and PC12 cells were included as positive controls (14). (B–F) Extracellular HA-tagged receptors or channels were cotransfected into COS7 cells with an equal amount of empty pcDNA3 vector (as a control) or pcDNA3 expressing AGS3. (B) Total protein levels were determined by a quantitative Western blot analysis using the Li-Cor Odyssey Infrared Imaging System. (C) Surface proteins levels were determined by the previously described chemiluminescence assay (19). (D) The surface-to-total ratio of Kir2.1 is increased by ≈42% in cells overexpressing AGS3. (E) A similar increase (≈36%) of the surface-to-total ratio of Kir2.1 was seen with a complementary biotinylation approach. 1x and 1y are arbitrary units and represent the total and surface levels of control samples, respectively. GAPDH was probed to assure the plasma membrane integrity during biotinylation. (F) Unlike AGS3, AGS3S and mPins both fail to significantly enhance the surface expression of Kir2.1. The biotinylation experiments were repeated twice and similar results were obtained. The values shown in the other graphs are the average of at least six independent experiments.

