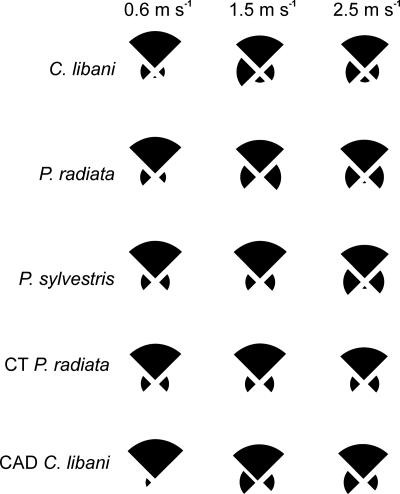
Fig. 2.
Patterns of pollen accumulation (fresh cones) or impact (CFD model cones) in four quadrants (windward, leeward, left, and right) of the cones' surfaces in relation to wind speed (m/s). In each pie chart, the uppermost slice indicates the surfaces in the windward quadrant and the lowermost slice is leeward. The area of each slice is proportional to the mean percentage of pollen accumulated or particles impacted in that quadrant. For all CFD simulations, data shown are for a particle density of 200 kg/m3.

