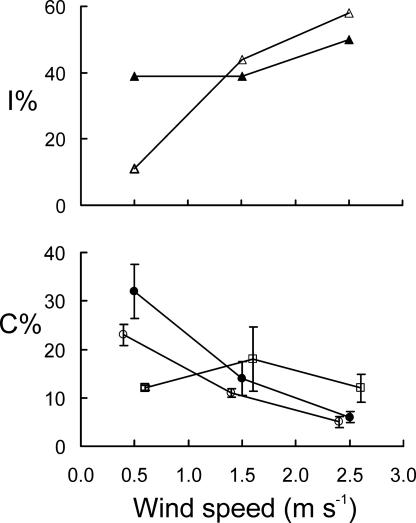
Fig. 3.
Relationships between wind speed (x axis) and either impaction efficiency (y axis, Upper) or collection efficiency (y axis, Lower). (Upper) Open symbols indicate the CAD model cone, and closed symbols indicate the CT model cone. In CFD simulations, pollen was represented by 60-μm spherical particles with a density of 200 kg/m3. (Lower) Open circles indicate P. radiata, closed circles indicate P. sylvestris, and squares indicate C. libani. Results are shown for wind-tunnel trials by using conspecific pollen. Points are interpolated, and some in Lower are slightly displaced along the x axis for ease of inspection only.

