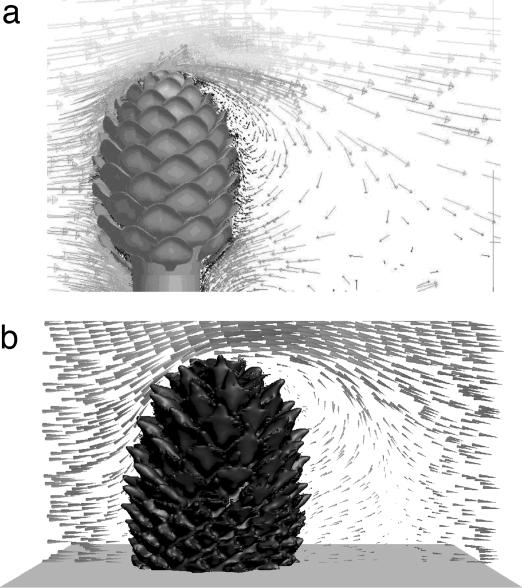
Fig. 4.
CFD visualizations of leeward recirculation of airstreams behind model ovulate cones. (a) CAD model based on C. libani. (b) CT model based on P. radiata. Prevailing airflow is from left to right. Note that the visualization of the CT cone does not fully reflect the surface detail of the computer model.

