Fig. 6.
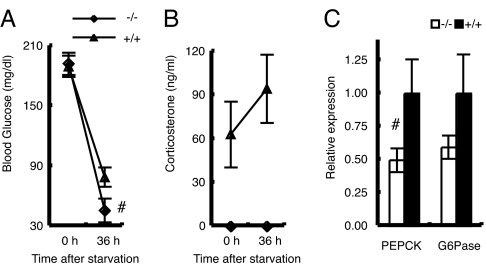
MC2R KO mice develop hypoglycemia during fasting. The experiment was performed with 12-wk-old male MC2R−/− (n = 5) and MC2R+/+ (n = 5) mice. (A and B) At time 0 (2000 hours), food was withdrawn and blood glucose (A) and serum corticosterone level (B) were measured. After 36 h, mice (at 0800 hours) were killed and serum samples and liver RNA were prepared. Expression of phosphoenolpyruvate carboxykinase (PEPCK) and glucose-6-phosphatase (G6Pase) in the liver was determined by qRT-PCR (C). Data are expressed as means ± SEM. The statistical difference was evaluated by two-way ANOVA (factor 1 was genotype and factor 2 was treatment) followed by t test to compare the significant difference between the glucose value for 36 h of MC2R KO mice and the glucose value for 36 h of WT mice. #, P < 0.05.

