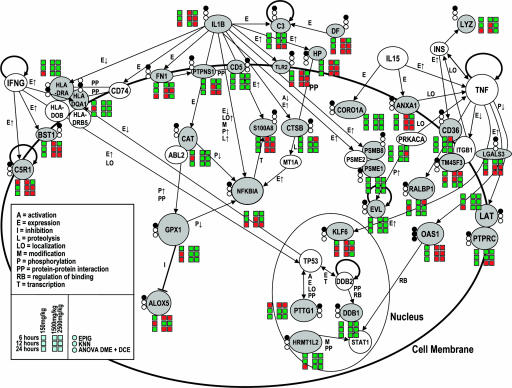
Fig. 2.
Differentially expressed genes in blood that discriminate between exposure to subtoxic/nontoxic or toxic dose of APAP. Pictured is a subgroup of genes involved in immune response and inflammation. Gray filling of circles beside genes indicates identification of genes in the list of discriminatory genes (top circle, EPIG; middle circle, k-NN, bottom circle, ANOVA DME and DCE), and coloring of squares signals direction of change (red, up-regulation; green, down-regulation in comparison with mock-treated control).

