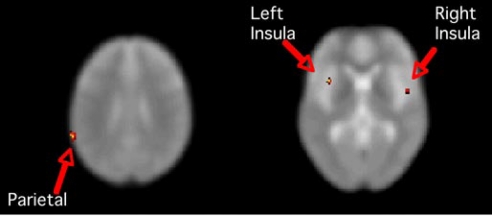
Fig. 1.
Greater activation in parietal cortex and insula in the absence of leptin supplementation. Images are SPM T maps of significant BOLD signal change greater when leptin supplementation was discontinued (vs. during supplementation) for the contrast high-calorie > low-calorie stimuli. Left image (z = 29) shows a significant cluster in the region of the left parietal supramarginal gyrus: extent = 52 voxels, t = 4.06, z score = 4.05, peak voxel x y z coordinates are −64 −48 26. Right image (z = 0) shows significant clusters bilaterally in the insula. Left insula: extent = 20 voxels, t = 3.9, z score = 3.89, peak voxel at −36 10 2. Right insula: extent = 26 voxels, t = 3.45, z score = 3.45, peak voxel at 48 0 0. Images are in neurologic orientation, displayed on the SPM5 EPI template. Coordinates are in MNI space, contrast comparisons at P < 0.001 uncorrected.

