
Fig. 4.
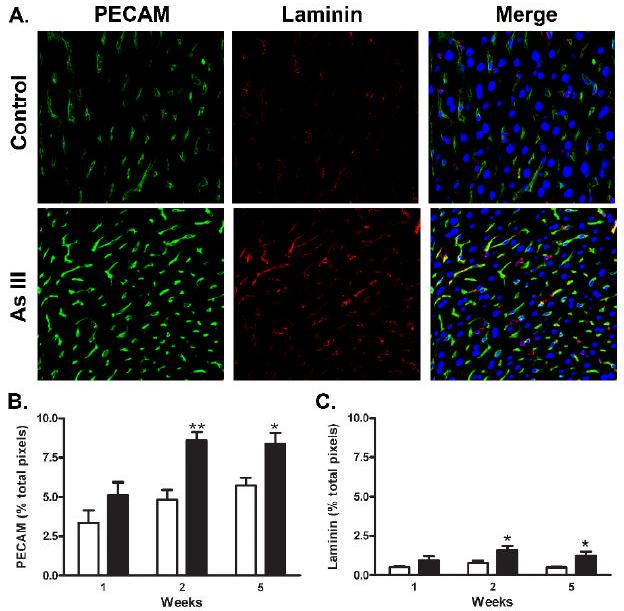
Arsenic induced expression of sinusoidal PECAM-1 and laminin protein. A. Thin sections were prepared from the livers of control mice or mice exposed to arsenite for 2 wk and immunostained for PECAM-1 (green channel) or laminin-1 (red channel). In the merged image, the blue channel was added to show DRAQ 5-stained nuclei. The representative confocal images were captured at 40x with a final magnification 400x. B., C. Morphometric analysis of confocal immunofluorescent images was used to quantify PECAM-1 and laminin-1 protein expression in groups of 6 mice at 1, 2, and 5 wk. Data are expressed as the mean ± SEM percentage of total pixels that stain positive for the respective protein per 400x microscopic field. The data were analyzed by two way analysis of variance and showed both significant time and treatment differences (** = p<0.01 and * = p<0.05).