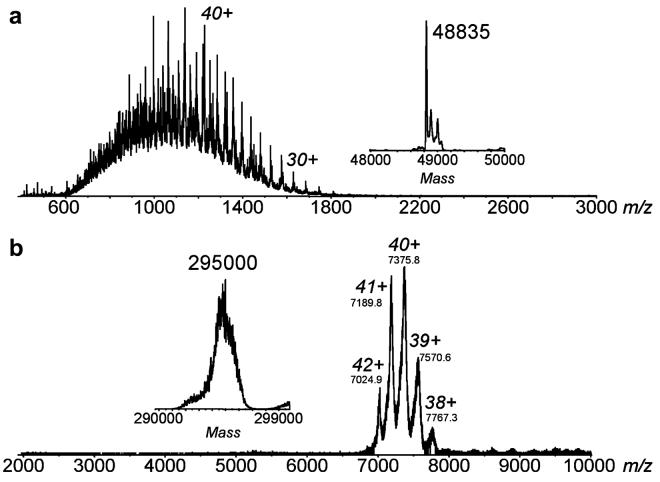
Figure 2.
ESI mass spectra of WT PDO acquired at pH 3 (A) and pH 6.8 (B). The corresponding mass spectra converted to the mass domain are shown in the insets. A denaturing pH 3 solution yields a MW for the monomer of 48,838 ± 3 Da. The protein complex measured under near native pH conditions yields 294,779 ± 53 Da.

