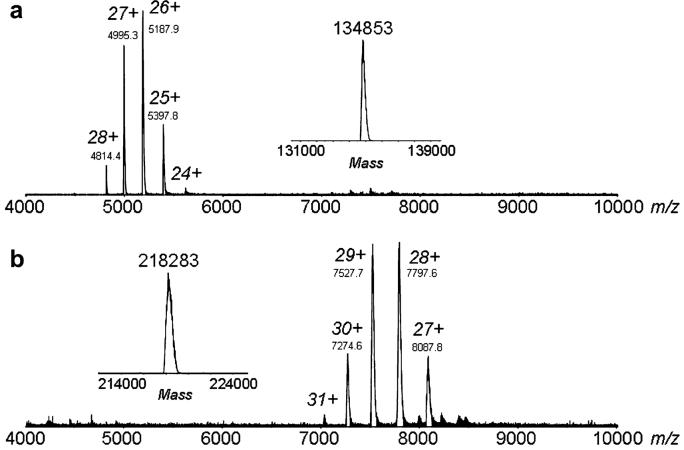
Figure 3.
ESI mass spectra of CarDO (A) and NDO (B) in 20 mM ammonium acetate, pH 6.8. The corresponding mass spectra converted to the mass domain are shown in the insets. For CarDO, a MW for the denatured monomer and the native α3 trimer was measured to be 44,711 ± 2 Da and 134,853 ± 9 Da, respectively. For NDO, the measured MWs for the denatured α- and β-subunits were 49,607 ± 2 Da and 22,802 ± 0.2 Da, respectively. The MW of the intact α3β3 native NDO complex was measured to be 218,283 ± 58 Da.

