
Figure 5. Effects of DEGS-1 inhibition on Cell Growth, Cell Cycle and pRb.
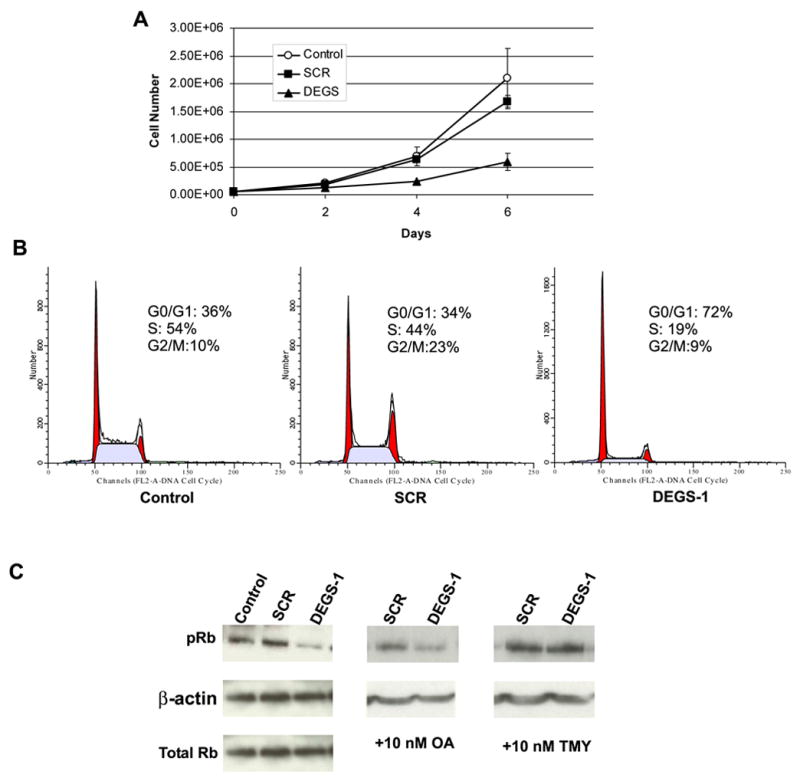
(A) The effects of loss of DEGS-1 on cell growth were determined by the trypan blue exclusion method as described under “Experimental Procedures.” SMS-KCNR cells were transfected with 10 nM DEGS-1 or a nonspecific siRNA (SCR) for 24 h and then split and plated, along with untransfected cells (control) in 6-well dishes (~ 5000 cells/well) in triplicate. Cells were counted on days 2, 4, and 6, and then the inhibition of growth in response to siRNA was determined from the cell survival plots. (B) The effects of siRNA to DEGS-1 on cell cycle profiles were determined and compared to that of untreated and non-specific siRNA (SCR) treated cells after 48 h using flow cytometry as described in “Experimental Procedures.” The figures presented are representative of at least two independent experiments. (C) Protein levels of pRb, total Rb, and β-actin were detected by Western blotting. Cells were pretreated for ~18 h with either 10 nM OA (C, center panel) or 10 nM TMY (C, right panel) prior to siRNA transfection. Total cell lysates were prepared 48 h after siRNA transfection. Equal amounts of proteins (30 μg) were run on 10% SDS-PAGE and blotted onto an Immobilon membrane as described in “Experimental Procedures.” β-actin was probed with to verify equal loading of proteins per lane. The figures presented are representative of at least three independent experiments.