
Figure 6. Effects of Fenretinide on Endogenous Sphingolipids and Desaturase Activity.
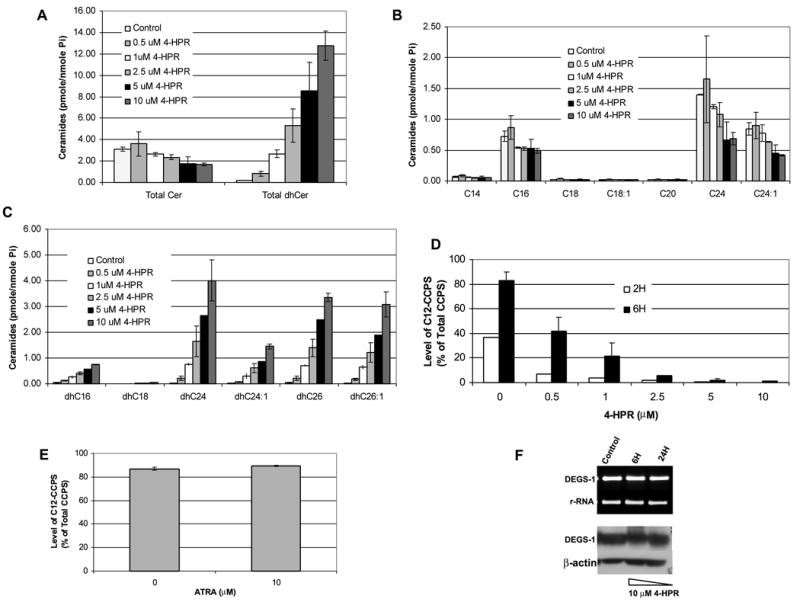
(A) SMS-KCNR cells were treated with increasing concentrations of 4-HPR for 6 h. Total endogenous levels of ceramides (Cer), dihydroceramides (dhCer), (B) Cer species, (C) and dhCer species were measured by LC/MS as described under “Experimental Procedures.” The sphingolipid levels were normalized to total lipid phosphate. The data presented are representative of the mean of 3 independent experiments ± S.D. (D,E) Desaturase activity was measured using our in-situ assay. Cells were treated with increasing concentrations of 4-HPR for 2 and 6 h (D) or 10 μM ATRA for 6 h (E). C12-dhCCPS was added at the same time as 4-HPR or ATRA. Cells were collected at these time points, and the conversion to C12-CCPS was determined by LC/MS. (F) The mRNA levels of 28s rRNA and DEGS-1 in response to 10 μM 4-HPR treatment for 6 and 24 h were measured by semi-quantitative RT-PCR. (F, upper panel) Expression of the DEGS-1 protein was detected by Western blotting (F, lower panel) Total cell lysates were prepared 6 and 24 h after 4-HPR treatment and, run on 10% SDS-PAGE. Equal amounts of proteins (30 μg) were blotted onto an Immobilon membrane as described in “Experimental Procedures.” β-actin was probed to verify equal loading of proteins per lane. The figures presented are representative of at least two independent experiments. The error bars represent the standard deviations, and when not seen, they are smaller than the thickness of the lines on the graphs.