Abstract
Rapid field scan on the order of T/s using high frequency sinusoidal or triangular sweep fields superimposed on the main Zeeman field, was used for direct detection of signals without low-frequency field modulation. Simultaneous application of space-encoding rotating field gradients have been employed to perform fast CW EPR imaging using direct detection that could, in principle, approach the speed of pulsed FT EPR imaging. The method takes advantage of the well-known rapid-scan strategy in CW NMR and EPR that allows arbitrarily fast field sweep and the simultaneous application of spinning gradients that allows fast spatial encoding. This leads to fast functional EPR imaging and, depending on the spin concentration, spectrometer sensitivity and detection band width, can provide improved temporal resolution that is important to interrogate dynamics of spin perfusion, pharmacokinetics, spectral spatial imaging, dynamic oxymetry, etc.
Keywords: CW EPR imaging, Rapid-scan, Rotating gradient, Digital signal processing, DSP, Direct detection
1. Introduction
In vivo EPR imaging can quantitatively provide useful physiological information such as the pharmacokinetics of free radical probes, the concentration of oxygen, the redox status of tissue, etc. [1]. Tissue oxygen status is an important factor in cancer treatment with chemotherapy or radiation. Also, the study of redox status of tissue will help in our understanding of oxidative stress, and such other aspects as tissue viability for transplant and wound-healing [2,3]. Since free radicals in situ are at very low concentration and most of them are short-lived, in vivo EPR imaging requires the introduction, via intravenous or intramuscular injection or implantation, of stable non-toxic free radical spin probes into the animal. Stable nitroxides and triarylmethyl radicals (TAMs) are being routinely used as probes to obtain physiologic information [4,5]. Both pulsed and CW methods have been developed for the purpose of small animal functional EPR imaging [6–8].
The very short transverse relaxation times (T2) of common stable free radicals such as nitroxides do not easily permit them to be studied using time-domain spectroscopy and are conveniently detected and imaged by CW EPR. The relatively slow scan rates of the field necessitated by the conventional low frequency field modulation and phase sensitive detection method makes the imaging time long, especially if one is performing spectral spatial imaging [9,10]. Ohno and Watanabe [11] and later Deng et al. [12] suggested scanning the Zeeman field in small incremental steps and at each step rotating the gradient field vector through 360° in a plane at a low frequency. At the end of such a scan, one has information on all the projections that can be unraveled from the detected signal by reshuffling the data. Because the gradient rotations and the sweep are integrated, very fast scans are not needed, and yet projection information is gathered much faster than in conventional CW imaging where the gradient vector remains constant throughout a given sweep.
If the limitation imposed by low frequency modulation and phase sensitive detection is removed one can use sweep rates that are arbitrarily fast. Joshi et al. and Stoner et al. [13,14] have recently published detailed accounts of performing EPR spectroscopy and imaging using rapid scan with direct detection. Earlier observation of rapid scan EPR with the spectra showing the effect of transverse relaxation on the scan speed was reported by Czoch et al. [15] in 1983. For very fast field scans, one superimposes a sinusoidal (AC) or a triangular magnetic field on the static Zeeman field by applying a suitable current to a secondary coil. Using large field amplitudes (1–5 mT) at kHz frequencies one can effectively accomplish scan rates on the order of several T/s and cover the required sweep widths in times on the order of microseconds. By carefully adjusting the Zeeman filed one can make the resonances to occur in the linear region of a sinusoidal fast sweep, and can perform rapid scan EPR spectroscopy and imaging. With fast scans one has to use direct detection of the EPR signals. Unlike the conventional phase sensitive detection where the detection band width can be quite narrow (few kHz), the rapid field sweep will require detection bandwidth on the order of MHz, with a concomitant reduction in signal to noise ratio. Ultra fast scan that traverses the spectral width in times on the order of transverse relaxation times will cause distortions in the spectral shape and in the limit of very fast scans produce ‘ringing’ at the trailing edge of the spectrum, similar to the free induction decay of spins in response to pulsed excitation. While it may not be necessary to scan at such speeds, it is quite easy to remove the ringing pattern and correct the line shape by well-known Fourier deconvolution technique commonly used in rapid scan correlation NMR and EPR spectroscopy [13,16,17].
A third alternative to perform rapid CW EPR imaging is the combination of rapid scan of the magnetic field and the simultaneous rotation of the gradients with direct detection. The present work describes the approach we have adopted for rapid scan rotating gradient CW EPR imaging, RSRG-CW-EPRI at 300 MHz.
2. Experimental aspects
Conventionally, CW EPR imaging is carried out with a constant gradient to produce an image of the unpaired spin probe distribution in one, two or three dimensions. The spectrum of the object is measured in presence of equally distributed orientations of a constant gradient applied in a polar coordinate raster centered about the object. Each spectrum is the sum of the line integrals of the spin density distribution along lines perpendicular to the gradient axis, and constitutes a profile or projection. Projections for gradients separated by 180° are identical, since interchanging the sample and the gradient directions does not affect the projection profile. These projections are suitably filtered [18–20] and back-projected to produce the 2D or 3D image of the object [21]. If it is necessary to generate additional spectral information in addition to spatial distribution of spins in the object, spectral-spatial imaging is performed, in which the additional virtual spectral dimension is created by a further variation in the magnitude of the space encoding gradient [22]. The present study concentrates in examining approaches, which can minimize data acquisition time in EPR imaging.
To understand the relationship between the main strategies of CW EPR imaging let us consider the elements in each projection profile. For a two dimensional polar raster of the gradient, we rotate the gradient vector from an arbitrary starting angle of 0° through 180°-θ, in steps of θ. 180° to 360-θ will reproduce the projections once more. For each value of the gradient angle we collect the projections. For simplicity, let us assume that we have 8 gradient orientations (θ1–θ8) and the projections are represented by 8 field positions (B1–B8). The 8 projections that will result from the 2D experiment will constitute a Bθ matrix of dimension 8 × 8. Let the rows represent the field values increasing from Bmin to Bmax from left to right, and let the columns represent the gradient orientations from 0 to 360°-θ, in steps of (360/8)°, from top to bottom. In the conventional CW imaging mode, we follow the collection of the projections by sweeping the field at constant gradient, and then sequentially reorient the gradient vector in a polar grid through equal intervals. In other words, we determine the elements of the Bθ matrix row-wise. This is indicated by the horizontal rows in Fig. 1. In rapid scan EPR imaging the imaging mode is essentially the same, except that the scan rates are very high, (and the projections may have to be subsequently processed to get rid of the FID-like ringing) and as such, here also, the Bθ matrix is collected row-wise. At scan speeds used in this work there was no FID-like ringing, and no corrections were applied.
Fig. 1.
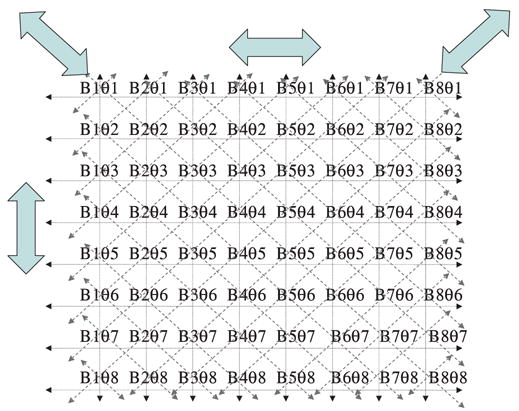
Elements of the Bθ matrix that represents the projections obtained at a constant gradient as a function of the orientation of the gradient vector. Elements are collected row-wise in conventional EPR imaging and column-wise in rotating-gradient stepped-field data collection. The large horizontal arrow represents the conventional way of collection projections at constant gradient vector at a given orientation, and then changing the orientation sequentially. The big vertical arrow represents the stepped-gradient-rotating-gradient approach of Ohno and Watanabe [11] and Deng et al. [12]. The big slanted arrow represents the present method that corresponds to the simultaneous application of the field sweep field and rotating gradients.
The vertical columns, on the other hand, correspond to filling the Bθ matrix column-wise and represents the determination of the elements by scanning the field in a stepwise fashion, with the gradients being completely rotated from 0° to 360°. Here the field will be incremented from start to end in a finite number of steps (eight in this simplified example) and the gradient will go from 0° to 360° in 8θ-steps. It could be rotated fully through 0–360° and the results from 180 to 360-θ can be added to those from 0 to (180-θ), because of the inversion symmetry of the projections. If we collect 8 data points as a function of the gradient rotation from 0 to 360-θ, per field position, these will constitute the first point in the 8 conventional projections, and, the 8 data points in the second field position will constitute the second points in the 8 conventional projections and so on. The number of projections in general will depend on the number of data samples acquired for a full rotation of the gradients, and the number of field steps from start to end will be the number of points digitally representing each projection.
We will now examine the possibility of simultaneously scanning the field and rotating the gradients to collect the elements of the Bθ matrix, represented by the diagonal arrow direction in Fig. 1. To reduce the collection-times of projection data, we shall combine rapid scan and rotating gradients with direct detection. This would lead to absorption profiles (rather than the first derivatives obtained in phase sensitive detection). While the direct detection is less sensitive compared to phase-sensitive detection, it is partially compensated by the fact that the profile intensity in absorption mode is an order of magnitude higher than in the first derivative mode [14]. Coming to the data collection strategy, if one looks along the diagonal of the matrix, it can be seen that both the field and the gradients monotonically increase. If we make one full sweep of the required region of the field by a rapid scan and digitize the signal in 64 or 128 steps (here it will be 8 steps) this will decide the field resolution (spatial resolution, depending on the magnitude of the gradient) and make a synchronous rotation of the gradient vector from 0° to 360° and the collected data will constitute the elements of the diagonal of the Bθ matrix. We can follow this by scanning the field from high to low (this will be advantageous since we do not jump from the high end of the field to the starting field abruptly, but simply perform a zigzag scan) still rotating the gradient from 0° to 360°. The detected signals will now fill the elements of the Bθ matrix along the anti-diagonal (right to left) from top to bottom. The other elements are to be filled along lines parallel to the diagonal or the anti-diagonal of the Bθ matrix, and in order to accomplish this we need to impart an incremental phase shift to the gradient rotation for each pair of upward and downward field scan. The mnemonic ways in which the Bθ matrix elements are acquired in the three modalities are depicted in Fig. 2.
Fig. 2.
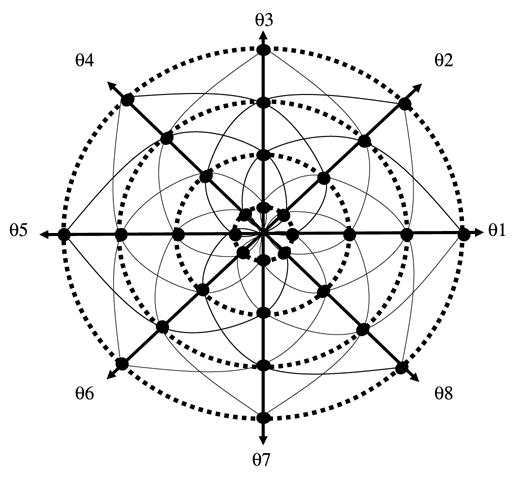
Mnemonic representation of the way we collect the elements of the Bθ matrix for various CW imaging modalities. The diagonal double-headed arrows (1–5, 2–6, 3–7, 4–8, 5–1, 6–2, 7–3, 8–4) represent conventional projection data collection, with 8 sweeps (B1–B8) each with constant gradient orientation from θ1 to θ8. The concentric dotted circles represent the stepped-field-rotating-gradient modality (Ohno et al. [25] and Deng et al. Ref. [12]), and the Kaleidoscopic pattern (continuous lines) represent the simultaneous rapid scan and rotating gradient strategy.
3. Instrumentation for rapid scan rotating gradient CW EPR
We cannot perform such imaging using the conventional CW EPR spectrometer that only allows fixed gradients, and slow sweep of the magnetic field. The rapid scan envisaged in this modality requires a secondary sweep coil supplementing the Zeeman field, which needs to produce only a small scan range that covers the spectral range of the object in presence of the gradients [14]. For rapid field scan we have designed a pair of Helmholtz coils placed very close to the resonator with its axis parallel to the Zeeman field, and the fast sweep is accomplished by using a low frequency (1–20 kHz) AC amplifier that produces magnetic field amplitudes of 5–10 mT, corresponding to nearly 5–10 T/s sweep rates, which is capable of sweeping 5 mT in just 50–100 μs. The sinusoidal sweep can also be replaced by a triangular ramp to provide alternatively forward and reverse field sweeps [13]. There is no particular advantage of using sinusoidal scans compared to triangular scans. Both can be easily generated digitally using platforms such as LabView®. However, the sharp corners of a triangular wave are subject to smoothening by the inductance of the coils, and consequently, will suffer deviation from linearity at the turning points. We plan to use only sinusoidal sweeps employing tuned gradient coils.
A careful analysis of the amplitude pattern of the sine wave shows that 35% (±17.5%) of the amplitude centered about the sign-crossover mid point of the sine wave is linear with deviation from linearity being less than 0.4%. The time taken for sweeping this linear range is 35% of half the cycle period. For a 1 kHz sinusoidal gradient with a peak-to-peak amplitude of 2.5 mT, we can calculate the linear range as 0.875 mT. This much field is traversed over a period of 175 μs (35% of half the cycle period) leading to a sweep rate of 5 T/s. The linear range of sweep and the sweep rates are thus related to the sweep frequency (SF) and the peak-to-peak amplitude (SA) as follows:
| (1) |
We use a low frequency of 0.33 kHz, and peak-to-peak field amplitude of 2.6 mT corresponding to a field scan rate in the linear sweep region of ~0.6 T/s. The sinusoidal sweep can also be replaced by a triangular ramp to provide alternatively forward and reverse field sweeps [13].
We also need to generate circularly polarized gradient fields by inputting gradient currents (AC fields) that produce identical field magnitudes with a specific phase relationship in the orthogonal coils (cosωt ± i sinωt). Since we would like to perform one complete rotation of the gradient during the linear regime of the sinusoidal rapid scan, it is necessary that the gradient rotation frequency is 3 or 4 times higher than the frequency of the AC magnetic field that provides the rapid scan. The resonator [23] and the magnet/gradient coils system of our 300 MHz CW EPR spectrometer [24] were employed for the rapid scan rotating gradient imaging experiment. The various subcomponents of the rapid scan rotating gradient CW imager are as follows.
3.1. Rapid scan coils
This consists of a pair of Helmholtz coils of 25 turns of Litz wire (175/38) of 20 cm average diameter and 20 cm apart, and positioned coaxial to the main Zeeman field. These set of coils are powered by a home made tunable amplifier in selectable ranges of frequencies up to a maximum of 40 kHz. The amplifier accepts an input of max. Five volts p-p and can generate a sinusoidal field sweep of up to 10.0 mT. The near-linear portion of the downward and upward swing of the sinusoid was capable of providing fast scans of up to 6 mT. In the current experiment, we employed a 1 mT scan range accomplished at a sweep rate of 0.6 T/s. The scan speed and the scan range are adjustable with the frequency and amplitude of the sinusoidal input to the AC amplifier that powers the sweep coil. In future, we are planning to use field scans in the frequency range 5–10 kHz and gradient scans in the range 20–40 kHz by using tuned gradient and field sweep coils.
3.2. Gradient coils
The set of orthogonal x, y and z gradient coils embedded in our CW EPR system [24] normally used for DC gradients in conventional experiments, were tuned by varying the capacitance so as to provide distortion free currents of up to 6–7 A at a frequency of 1 kHz with input voltage amplitude of 2–3 V.
3.3. Direct detection scheme
In order to implement the direct detection scheme we have modified our CW bridge [24] by replacing the dual diode RF detector and phase sensitive receiver with a standard double balanced mixer and the wide band (1 MHz) preamplifier SRS 560 (Stanford Research) connected to IF port of the mixer. The resonator was tuned and matched, and the reference arm was adjusted to produce zero offset at the amplifier input. A DC gain of 500 (out of possible 5000) was sufficient to produce proper signal for the digitizer.
3.4. Digital generation of rotating gradients and rapid scan field sweeps
The lower frequency rapid scan signal, the three higher frequency gradient signals, and the trigger signals for data acquisition were generated using National Instruments LabView® software and National Instrument PCI-6289 multifunction data acquisition card. This card is capable of generating four independent 16-bit analog signals at a maximum voltage of 10 Vp-p and a maximum output rate of 2.8 MS/s. The card can also output up to 48 digital input/output signals. The phases of the three gradient signals can be altered programmatically relative to the phase of the rapid scan signal. For example, to acquire images parallel to the XZ plane, the X and Z gradient outputs are set 90° out of phase relative to each other and at a frequency three times higher than the rapid scan field. The amplitudes of the gradient signals are adjusted to result in a circularly polarized gradient field rotating in the XZ plane at the selected frequency. The phase of the X and Z gradients can then be incremented programmatically relative to the rapid scan field at a desired step interval.
3.5. Data acquisition
The EPR signals from the low noise amplifier were captured using a commercial digitizer-cum-summer Acqiris AP100 (Acqiris USA, Monroe, CA) dual channel Signal averager [25] capable of sampling up to 500 Ms/s per channel, and summing in real time with external time base and trigger inputs. The Acqiris signal averager was programmed to fully automate the signal collection. The simplified schematic of the rapid scan rotating gradient CW EPR imager is given in Fig. 3.
Fig. 3.
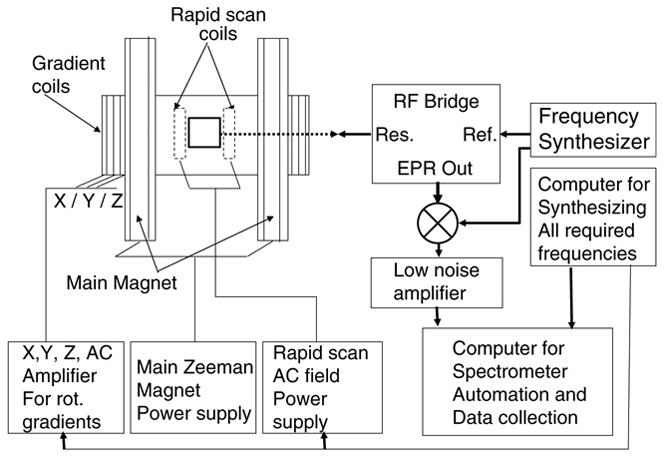
Simplified schematics of the rapid scan rotating gradient CW EPR Imager.
4. Results and discussion
In order to verify the basic idea of simultaneous field scan and gradient rotation, we used 2D measurements on two point phantoms consisting of two capillary tubes containing ~1 mg of the stable paramagnetic compound N-methyl pyridinium tetracyano quinodimethane (NMP-TCNQ) which gives a sharp exchange narrowed single EPR line. The sample we have used had a line width (Full Width at Half Maximum height) of 22.5 μT. After placing the two tubes separated by 1 cm, perpendicular to the Zeeman field inside the parallel coil resonator (Fig. 4), we first applied the AC sweep field alone. For each cycle of the AC sweep through resonance there was single narrow EPR line. First, the center field from the main magnet is adjusted such that there is only one resonance line per cycle of field sweep, when the maximum amplitude and the minimum amplitude from the sinusoidal field plus the Zeeman field match the resonance condition. The difference between these values is the maximum sweep size for the particular setting. By moving the DC field position exactly in between the two values, we ascertain that the resonances occur in the middle of the up and down sweeps of the rapid scan sinusoids, giving two sharp lines per cycle of the sweep field (Fig. 4). By switching on the gradient coils one would normally see the splitting of the resonances, but because the gradients (here X and Z gradients) are oscillatory, the patterns (pseudo-projections) are not easy to interpret. By using a pickup coil and orienting the same perpendicular to the X- and Z-axes of the gradient axis co-ordinates and adjusting the amplitude of the X- and Z-axes input voltage, the gradients coils could be calibrated to provide equal magnitude of field amplitudes. In presence of the space encoding rotating gradients the resonance line undergo splitting and are simultaneously subject to both field sweep and gradient sweep.
Fig. 4.
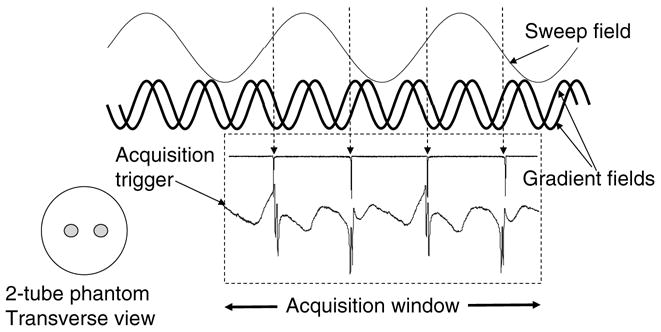
Direct detected rapid scan absorption EPR signals of a phantom sample consisting of two capillary tubes containing a mg each of particulate TCNQ (N-methylpyridinium tetrcyanoquinodimethane, a stable charge-transfer complex that give an exchange-narrowed single line EPR spectrum) sample. The top sinusoid represents the rapid scan sweep, and the two higher frequency sinusoids represent the X and Z gradients, which together provide the rotating gradient in the XZ plane. The left side of the dotted rectangle represents the start of the trigger. The field scan frequency was 333.33 Hz and the gradient rotation frequency was 1 kHz. The sampling frequency was 4 Ms/s and 25,000 points were collected, giving rise to two downfield scans (first and the third spectrum) and two up field scans (second and the fourth spectrum). The zero-gradient spectra (upper) and the spectra under rotating gradient (lower) at an arbitrary starting phase are shown.
In order to collect the signals as a function of the field sweep and gradient sweep, a trigger pulse was generated at a predetermined delay from the peak of the rapid scan signal. Once the trigger pulse activates the digitizer, it will acquire a pre-selected number of signal points and coherently add subsequent acquisitions to generate pseudo-projections. It should be mentioned here, that depending upon the acquisition time and the acquisition interval chosen, we might end up collecting several projections representing sweeps that alternatively change direction (low field to high field and then high field to low field). With the frequencies of the sweep and gradients respectively at 333.33 and 1000 Hz, we sampled 25,000 points at a sampling rate of 4 Ms/s corresponding to two full cycles of the field sweep giving rise to two pairs of pseudo-projections for the up field and down field sweeps (Fig. 4). To improve the signal to noise ratio, one can average several spectra. In our case we averaged 100 spectra per gradient phase. Once the averaging of the predetermined number of spectra has been carried out, the phase of the X and Z gradients were rotated by an increment θ relative to the phase of the rapid scan signal and the spectra were averaged again. This process is continued until the phases have been systematically incremented through θ steps from 0 to 360-θ. By doing this we would have collected all the required “pseudo projections” that represent the matrix elements parallel to the diagonal or anti-diagonal of the Bθ matrix. Experimental results obtained for a two-tube TCNQ phantom are given in Fig. 5A and B. Each signal acquired during the interval corresponding to one full cycle time of the gradient rotation, centered around the spectral position corresponding to the zero-gradient spectrum, forms a pseudo-projection which should be reorganized to lie parallel to the diagonal or anti-diagonal (depending on the sense of the sweep) of the final Bθ matrix by a simple matrix manipulation. At this stage, the well-known filtered back projection is used to obtain the images. Once the matrix manipulations have been carried out, we can choose just the required portion of the projections, and, if needed, interpolate the data to improve the digital resolution. Results obtained from a six-tube phantom are also shown in Fig. 5C and D.
Fig. 5.
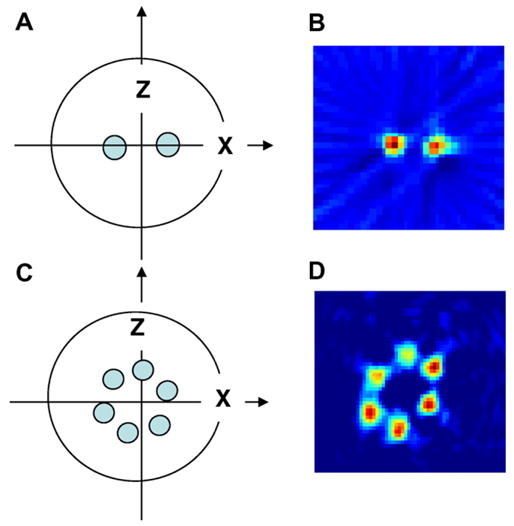
(A) Two-tube TCNQ phantom, (B) the image obtained by filtered back-projection after shuffling the Bθ matrix obtained along the diagonal. (C) A six-tube phantom consisting of 2 mM triarylmethyl radical Oxo63 in saline ranging from 400 to 500 mL in volume and (D) pseudo-projections were matrix-shuffled to give the correct projections and back projected to give the image shown.
The way in which conventional projections are transformed into “pseudo projections” by simultaneous rapid field scan and rotation of gradients and how these are reconverted to normal projections, before back-projection can be easily simulated using the Radon transform and filtered back-projection programs that are well-known. The simulations are shown in Fig. 6 for a 2-tube phantom.
Fig. 6.
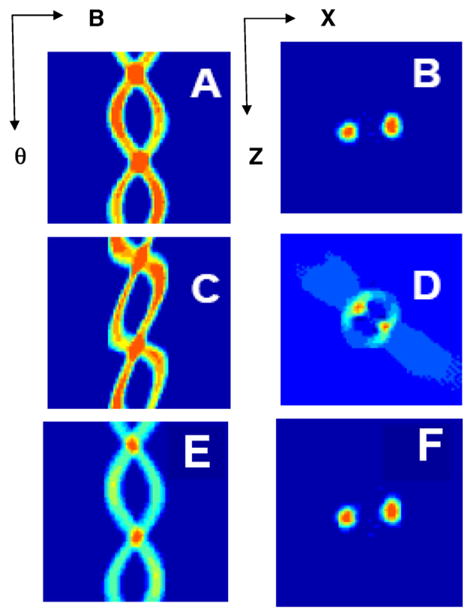
(A) 2D projections (shown as a sinogram) obtained by rotating the gradient in the XZ plane for 2-tube phantom with the axis perpendicular to the XZ axis and (B) the image of such a phantom via filtered back-projection. (C) 2D pseudo-projections and the corresponding back-projected pseudo-image obtained by transforming the projection matrix that correspond to data that would be obtained by a forward scan of field combined with rotating gradient of the same magnitude as in A and B. (D) The pseudo-image obtained by simply back-projecting the data in C and is not the true image, as expected. (E) Correct sinogram obtained by reshuffling the matrix corresponding to (C). (F) Image obtained by back-projection of (E) which is identical to (B).
Preliminary results obtained in this work on the phantoms clearly demonstrate the feasibility of the simultaneous rapid scan and field gradient rotation in CW EPR imaging. It is straight-forward to extend the same to three dimensions, which involves additional tilting of the plane of the rotating gradients with respect to the third gradient axis, and manipulating the resulting pseudo-projection matrices before performing a two-stage filtered back-projection. There are a few points to consider before employing such a Rapid-scan Rotating Gradient CW EPR imaging as a routine imaging modality. These include: (a) One should optimize the SNR of the Rapid scan EPR signals by choosing a suitable low-noise amplifier with proper detection bandwidth and gain factor; (b) it is important to precisely tune and calibrate the gradient coils under the AC current so that the gradients are circularly polarized with minimal/negligible elliptical components; (c) Solenoidal resonators may act as good antenna for the oscillatory gradients and will lead to sinusoidal base-line artifacts. It can be seen from Fig. 4 that the gradient-free spectrum on the top has a flat base-line and only when the gradients are on we see the base-line roll. We have carefully looked at the base-line roll and it exactly follows the sum of the amplitudes of the gradients. This is because the parallel coil resonator in which the measurements are done acts like an antenna and picks up the rotating gradient magnetic field. This baseline roll was removed by subtracting the background obtained from the measurement when the field is offset far from resonance (d) The scan speed needs to be optimized keeping in mind the increased bandwidth to be detected due to the rapid scan, as well as the increased presence of FID-like ringing artifacts, although the latter can be removed by Fourier deconvolution methods [13,16,17]. It is envisaged that too fast a scan speed that will introduce FID-like ringing (and hence will require removal by Fourier deconvolution) will hardly be needed in view of the gradient induced broadening, and yet the scan will be several orders of magnitude faster than that employed in conventional low frequency modulation mode enabling very fast CW EPR imaging.
When all precautions are taken into account it may be possible to produce CW EPR images at speeds that match with time-domain methods, and yet may use RF power levels that are several orders of magnitude lower. Indeed if that is realized, the availability non-toxic narrow-line compounds such as those based on triarylmethyl radical, will make CW EPR quite a viable approach for quantitative estimate of tissue oxygenation, temporally well-resolved estimates of redox status and investigations of tumor physiology in an in vivo setting.
The results presented here cover just preliminary, ‘proof-of-principal” data. We are in the process of further optimizing the speed of rapid scan rotating gradient CW imaging in two and three dimensions, as well as performing spectral-spatial imaging and oxymetry. Once this is established, a realistic comparison of the merits of this modality with other CW methods, as well as pulsed EPR imaging will be possible which will help us to choose the most optimal EPR imaging and oxymetry approach for a given in vivo system. Simultaneously we are also implementing digital signal processing (DSP) methods that would allow speeding up the data acquisition and improvements in signal to noise ratio. We believe that CW EPR imaging and oxymetry using combined rotating gradients and rapid scan with the direct detection scheme has the potential to provide functional images with high temporal and spatial resolution at low RF power levels.
References
- 1.Berliner LJ, editor. In Vivo EPR (ESR) Vol. 18. Kluwer Academic; New York: 2003. [Google Scholar]
- 2.Hunt TK. Oxygen: At the foundation of wound healing—Introduction. World J Surg. 2004;28:291–293. doi: 10.1007/s00268-003-7405-x. [DOI] [PubMed] [Google Scholar]
- 3.Kuppusamy P, Li HQ, Ilangovan G, Cardounel AJ, Zweier JL, Yamada K, Krishna MC, Mitchell JB. Noninvasive imaging of tumor redox status and its modification by tissue glutathione levels. Cancer Res. 2002;62:307–312. [PubMed] [Google Scholar]
- 4.Ardenkjaer-Larsen JH, Laursen I, Leunbach I, Ehnholm GJ, Wistrand LG, Petersson JS, Golman K. EPR and DNP properties of certain novel single electron contrast agents intended for oximetric imaging. J Magn Reson. 1998;133:1–12. doi: 10.1006/jmre.1998.1438. [DOI] [PubMed] [Google Scholar]
- 5.Halpern HJ, Peric M, Yu C, Barth ED, Chandramouli GVR, Makinen MW, Rosen GM. In vivo spin-label murine pharmaco-dynamics using low-frequency electron paramagnetic resonance imaging. Biophys J. 1996;71:403–409. doi: 10.1016/S0006-3495(96)79241-X. [DOI] [PMC free article] [PubMed] [Google Scholar]
- 6.Halpern HJ, Bowman MK, editors. Low Frequency EPR Spectrometers: MHz Range. CRC Press; Boca Raton: 1991. [Google Scholar]
- 7.Kevan L, Bowman MK, editors. Modern Pulsed and Continuous-wave Electron Spin Resonance. Wiley; New York: 1990. [Google Scholar]
- 8.Subramanian S, Yamada K, Irie A, Murugesan R, Cook JA, Devasahayam N, Van Dam GM, Mitchell JB, Krishna MC. Noninvasive in vivo oximetric imaging by radiofrequency FT EPR. Magn Reson Med. 2002;47:1001–1008. doi: 10.1002/mrm.10133. [DOI] [PubMed] [Google Scholar]
- 9.Eaton GR, Eaton SS, Maltempo MM. 3 Approaches to spectral spatial EPR imaging. Appl Radiat Isotopes. 1989;40:1227–1231. [Google Scholar]
- 10.Mailer C, Robinson BH, Willimas BB, Halpern HJ. Spectral fitting: The extraction of crucial information from a spectrum and a spectral image. Magn Reson Med. 2003;49:1175–1180. doi: 10.1002/mrm.10474. [DOI] [PubMed] [Google Scholar]
- 11.Ohno K, Watanabe M. Electron paramagnetic resonance imaging using magnetic-field-gradient spinning. J Magn Reson. 2000;143:274–279. doi: 10.1006/jmre.1999.2005. [DOI] [PubMed] [Google Scholar]
- 12.Deng YM, He GL, Petryakov S, Kuppusamy P, Zweier JL. Fast EPR imaging at 300 MHz using spinning magnetic field gradients. J Magn Reson. 2004;168:220–227. doi: 10.1016/j.jmr.2004.02.012. [DOI] [PubMed] [Google Scholar]
- 13.Joshi JP, Ballard JR, Rinard JA, Quine RW, Eaton SS, Eaton RR. Rapid-scan EPR with triangular scans and Fourier deconvolution to recover the slow-scan spectrum. J Magn Reson. 2005;175:44–51. doi: 10.1016/j.jmr.2005.03.013. [DOI] [PubMed] [Google Scholar]
- 14.Stoner JW, Szymanski D, Eaton SS, Quine RW, Rinard GA, Eaton GR. Direct-detected rapid-scan EPR at 250 MHz. J Magn Reson. 2004;170:127–135. doi: 10.1016/j.jmr.2004.06.008. [DOI] [PubMed] [Google Scholar]
- 15.Czoch R, Duchiewicz J, Francik A, Indyka S, Koscielniak J. EPR spectrometer with rapid scan. Meas Automatic Contr. 1983;29:41–43. [Google Scholar]
- 16.Dadok J, Sprecher RF. Correlation NMR-spectroscopy. J Magn Reson. 1974;13:243–248. [Google Scholar]
- 17.Gupta RK, Ferretti JA, Becker ED. Rapid scan Fourier-transform NMR-spectroscopy. J Magn Reson. 1974;13:275–290. [Google Scholar]
- 18.Ramachandran GN, Lakshminarayanan AV. Three-dimensional reconstruction from radiographs and electron-micrographs:application of convolutions instead of Fourier transforms. Proc Natl Acad Sci USA. 1971;68:2236–2240. doi: 10.1073/pnas.68.9.2236. [DOI] [PMC free article] [PubMed] [Google Scholar]
- 19.Shepp LA, Logan BF. The Fourier reconstruction of a head section. IEEE Trans Nucl Sci. 1974;NS-21:21–43. [Google Scholar]
- 20.Shepp LA. Computerized tomography and nuclear magnetic resonance. J Comp Assist Tomogr. 1980;4:94–107. doi: 10.1097/00004728-198002000-00018. [DOI] [PubMed] [Google Scholar]
- 21.Kak AC, Slaney M. Principles of Computerized Tomographic Imaging. IEEE Press; New York: 1988. [Google Scholar]
- 22.Eaton SS, Eaton GR. EPR imaging. Spectroscopy. 1986;1:32–35. [Google Scholar]
- 23.Devasahayam N, Subramanian S, Murugesan R, Cook JA, Afeworki M, Tschudin RG, Mitchell JB, Krishna MC. Parallel coil resonators for time-domain radiofrequency electron paramagnetic resonance imaging of biological objects. J Magn Reson. 2000;142:168–176. doi: 10.1006/jmre.1999.1926. [DOI] [PubMed] [Google Scholar]
- 24.Koscielniak J, Devasahayam N, Moni MS, Kuppusamy P, Yamada K, Mitchell JB, Krishna MC, Subramanian S. 300 MHz continuous wave electron paramagnetic resonance spectrometer for small animal in vivo imaging. Rev Sci Instrum. 2000;71:4273–4281. [Google Scholar]
- 25.Subramanian S, Matsumoto KI, Mitchell JB, Krishna MC. Radio frequency continuous-wave and time-domain EPR imaging and Overhauser-enhanced magnetic resonance imaging of small animals: instrumental developments and comparison of relative merits for functional imaging. NMR in Biomedicine. 2004;17:263–294. doi: 10.1002/nbm.897. [DOI] [PubMed] [Google Scholar]


