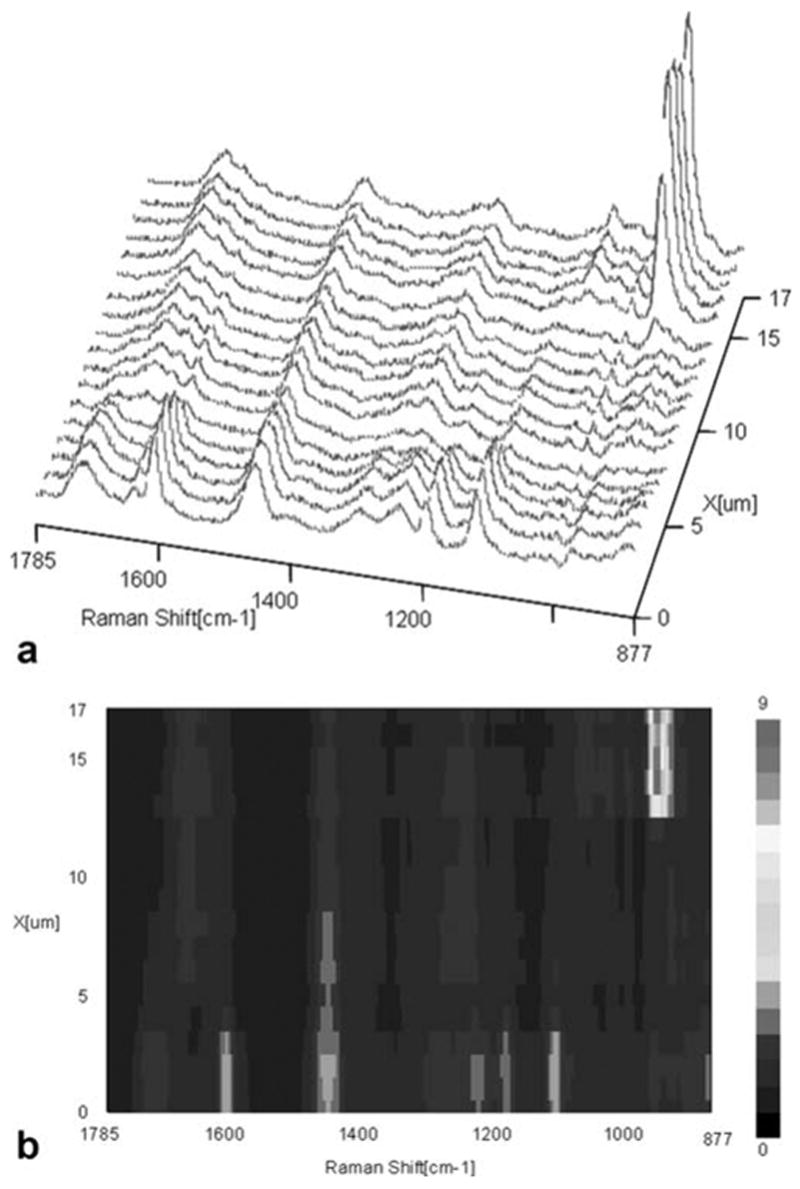
Figure 2.

Micro-Raman mapping spectra acquired at 1-μm intervals across the SB adhesive/noncarious dentin interface (A); a contour plot over the spectral windows of 877–1785 cm−1 and a spatial range of 18 μm over the adhesive/noncarious dentin interface (B). [Color figure can be viewed in the online issue, which is available at www.interscience.wiley.com.]
