
Figure 7.
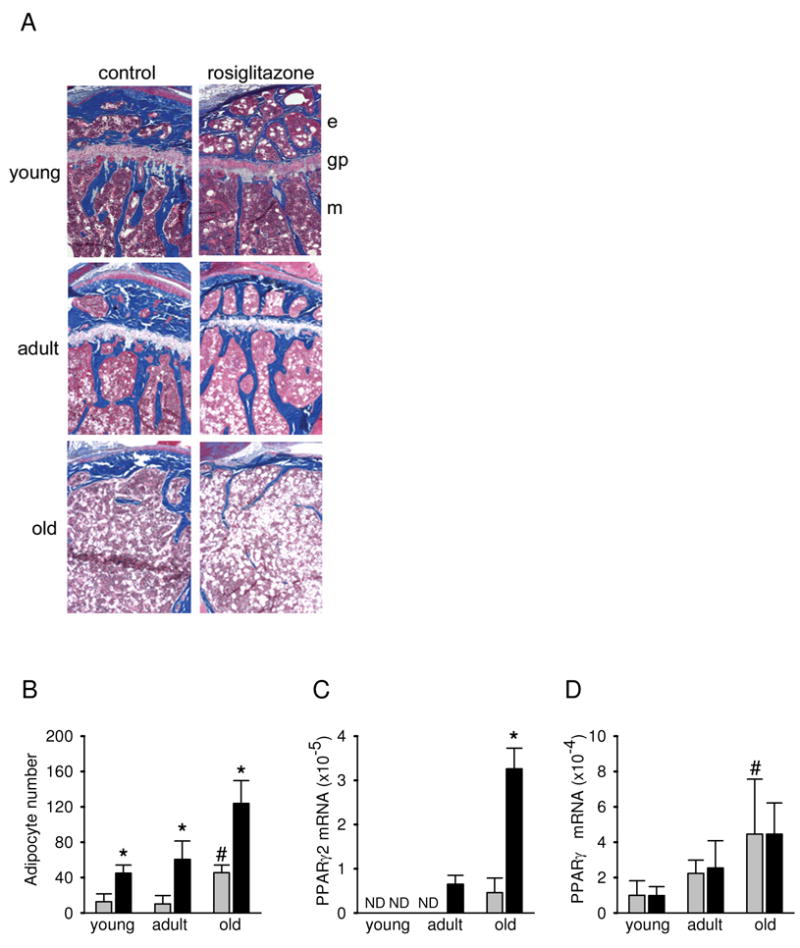
Examination of histological appearance and PPARγ expression in the proximal tibia. (A) Histological appearance. Undecalcified tibiae were obtained from young, adult and old control and rosiglitazone treated mice and embedded in methyl methacrylate, sectioned, and stained with Golden trichrome (2). Mineralized bone tissue is stained blue. The unstained areas in the bone marrow represent empty spaces previously occupied by adipocytes. Magnification 4×. e – epiphysis, gp – growth plate, m – methaphysis. (B) Marrow adipocyte number in the methaphysis of the proximal tibia. Adipocytes were recognized based on the distinct appearance of round empty spaces in the processed specimens. Cell numbers represent a mean of 5 fields per bone at a magnification 20×. Data were collected from the tibiae of 5 animals from each group. (C) Levels of PPARγ2 mRNA expression in whole tibia. (D) Levels of PPARγ1 mRNA expression in whole tibia. Gene expression was measured using real-time PCR. Gray bars – control; black bars – rosiglitazone; * p < 0.05 vs control; # p < 0.05 vs young animals. ND – mRNA expression below detection level.