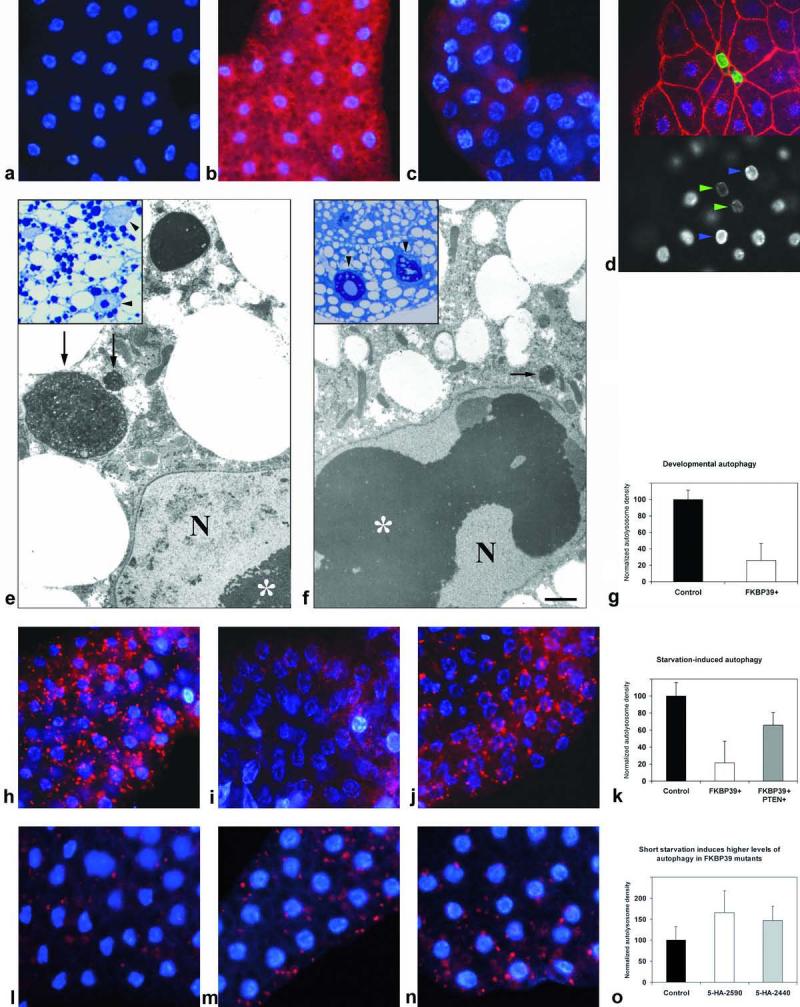
Figure 1.

Overexpression of FKBP39 inhibits developmental and starvation-induced autophagy, whereas loss of FKBP39 function leads to higher than wild-type induction of autophagy.
a-c: Lysotracker staining of fat bodies. No Lysotracker staining is seen in feeding early third instar larvae (a), whereas Lysotracker-positive granules (shown in red) accumulate in fat body cells of wandering late third instars (b). Overexpression of FKBP39 in the fat body inhibits the formation of Lysotracker-positive granules (c), and leads to an inhibition of cell growth. This effect is best seen by cortical actin staining (red) of fat bodies clonally overexpressing FKBP39, marked by co-overexpression of nuclear GFP (green) (d, top panel). Lower panel shows DNA staining. Note that the nuclei of FKBP39-overexpressing cells (green arrows) are of the same size but contain less DNA than surrounding wild-type cells (blue arrows). e-f: electron microscopic images show fat body cells of late third instar larvae. Developmental autophagy results in the accumulation of large autolysosomes in wild-type larvae (arrow in e), whereas only small autolysosomes are seen in FKBP39-overexpressing fat body cells of the same age (arrows in f). Note the greatly enlarged nucleolus in f (asterisk), also caused by the overexpression of FKBP39. g shows quantitation of Lysotracker data on developmental autophagy. h-j: Lysotracker staining of fat bodies. Autophagy in fat body cells of early third instar larvae, induced by a 4-hour starvation (h, compare to a). Fat body-specific overexpression of FKBP39 also blocks this starvation response (i). Co-overexpression of PTEN restores autophagy inhibited by FKBP39 (j). k shows quantitation of Lysotracker data. l-n: Lysotracker staining of fat bodies. Short (80-minute) starvation induces higher levels of autophagy in fat bodies of FKBP39 mutant larvae than in wild-type controls (m, n, compare to l). o shows quantification of the results.
Panels a-d, h-j and l-n are of the same magnification (200x). Panels e-f are of the same magnification and the bar equals 1 um. N marks the nucleus in electron microscopical images. Error bars represent standard deviation in panels g, k and o. Genotypes: UASFKBP39/+ (a, b, e, h), cgGal4/UASFKBP39 (c, f, i), hsFLP; UASFKBP39/+; Act>CD2>Gal4, UASGFPnls/+ (d), cgGal4/UASFKBP39, UASPTEN (j), w1118 (l), w1118; 5-HA-2590/Df(3R)Exel6194 (m), w1118; 5-HA-2440/Df(3R)Exel6194 (n).
