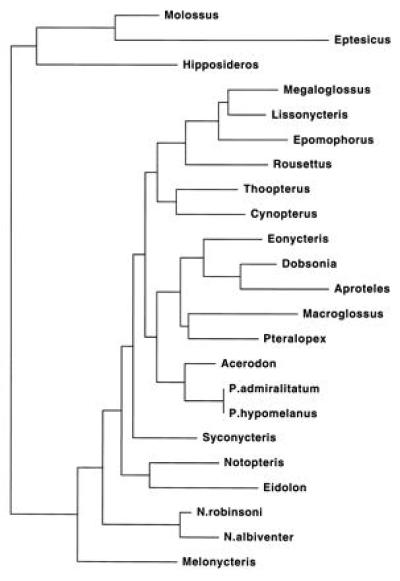
Figure 3.

Maximum-likelihood tree under the HKY85 model of sequence evolution. −ln likelihood = 6136.62167. For scale, the terminal branch leading to Molossus represents 2.2% nucleotide substitution.

Maximum-likelihood tree under the HKY85 model of sequence evolution. −ln likelihood = 6136.62167. For scale, the terminal branch leading to Molossus represents 2.2% nucleotide substitution.