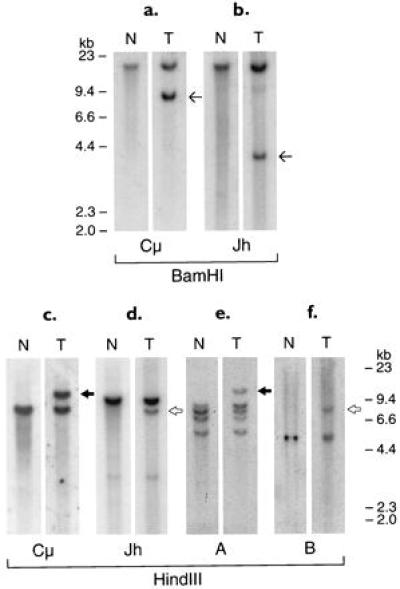
Figure 1.

Southern blot analysis of tumor 430 DNA digested with BamHI and HindIII enzymes and hybridized with IGH probes (a–d) and probes located across the chromosomal breakpoints (e and f). Thin arrows indicate non-comigrating Cμ and JH BamHI rearrangement bands. Solid arrows indicate comigrating HindIII rearrangement bands with Cμ and probe A (Fig. 2I). Open arrows indicate comigrating HindIII rearrangement bands with JH and probe B (Fig. 2III). The same filter was successively rehybridized with the different probes.
