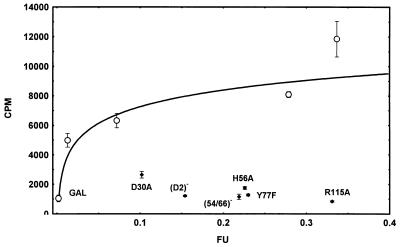
Figure 2.
MHC class II binding of selected LAG-3 mutants compared with that of wtLAG-3 expressed at different levels. COS-7 cells were transfected with GAL (30 μg/ml) and 3, 10, 30, and 100 μg/ml of pCDM8-wtLAG-3 DNA, respectively (○). Mutant LAG-3 DNA was used at 30 μg/ml. LAG-3 expression is shown as arbitrary fluorescence units (FU) using 15A9 mAb, and class II binding was determined by cpm counting in a cell–cell adhesion assay using 51Cr-labeled Daudi cells.

