
Figure 4.
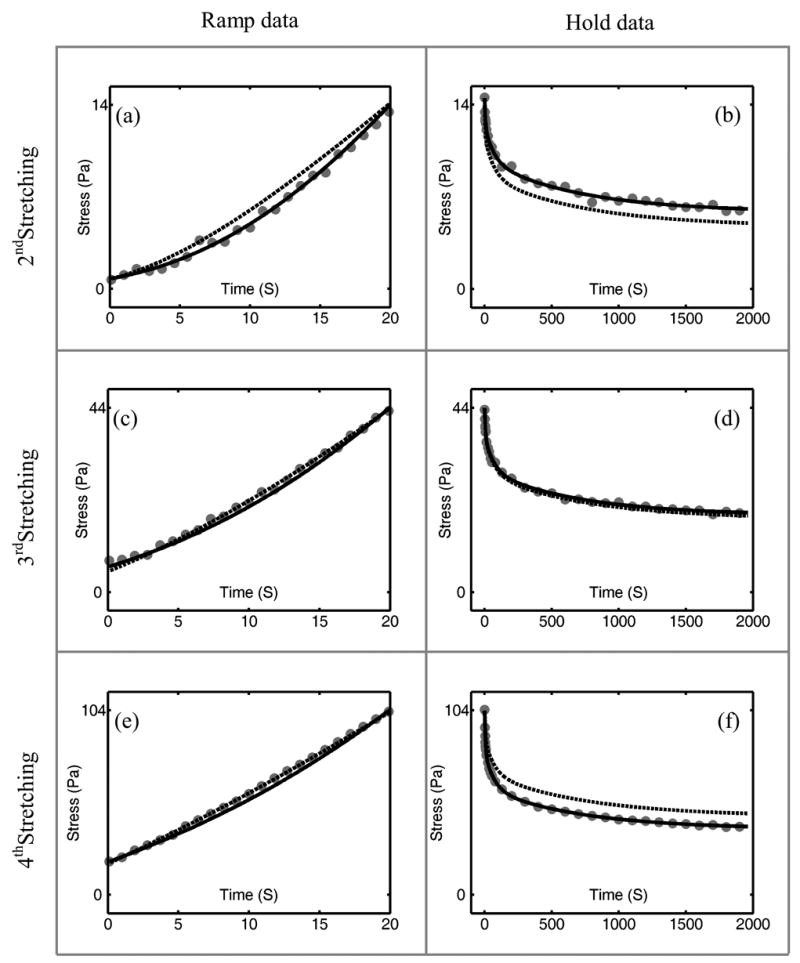
Predictions of the Fung QLV model (dashed lines) compared to those of the adaptive QLV model (solid lines) for incremental ramp and hold data (gray dots) for the second, third and fourth ramp- and-hold tests. The three rows correspond to ramp-and-hold tests from strains of 4.3% to 11% ((a) and (b)), 11% to 17.7% ((c) and (d)) and 17.7% to 24.3% ((e) and (f)). Stress is calculated by dividing the recorded force by 30 mm2, the nominal cross-sectional area of the specimens.