
Figure 1. Effect of Food Deprivation on Each Pituitary Cell type.
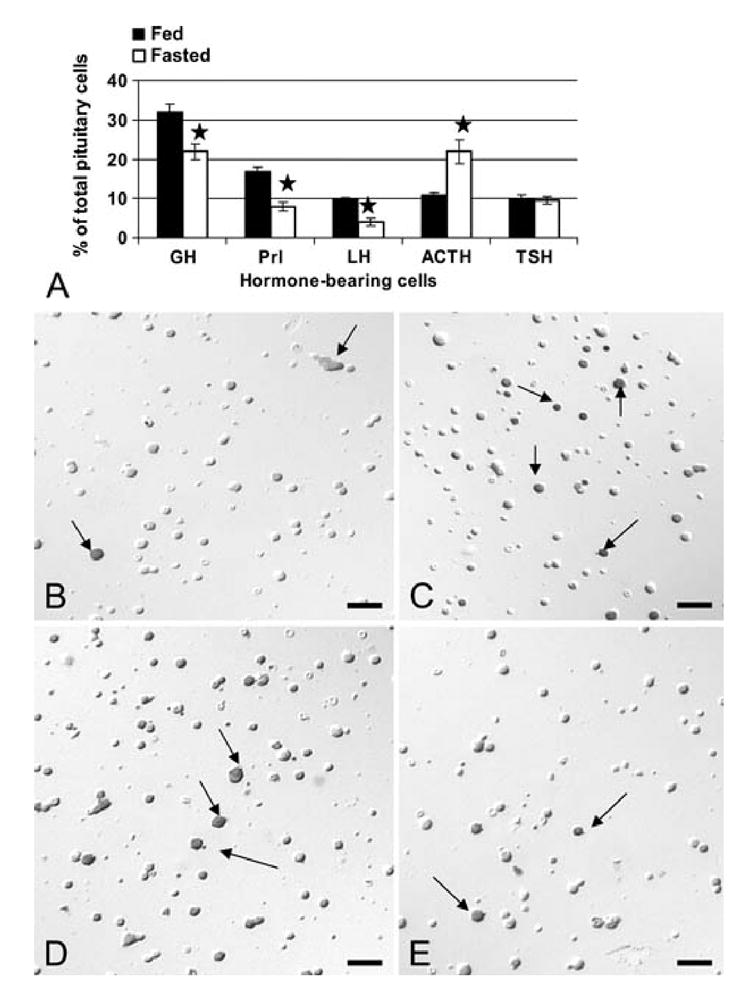
Counts and photographs show the effects of a 24 h food deprivation on pituitary cells detected by immunolabeling. Figure 1A shows the analysis of changes in the percentages of each cell type in the anterior pituitary (AP). The stars indicate a significant difference when compared with the populations from fed rats. The photographs were taken of freshly dispersed cells fixed after 1 h in culture and immunolabeled for one of the 6 pituitary hormones. The fields were imaged and photographed under Nomarski optics. Therefore, whereas a gray shadow may provide image depth showing the cells in 3-D, the immunolabeling itself is black (arrows). Figure 1B and C illustrates the increased percentages of corticotropes immunolabeled with anti- 17-39ACTH comparing fed (Fig 1B) and fasted (Fig 1C) rats. Figures 1D and E illustrate immunolabeled GH cells in fed (Fig 1D) and fasted (Fig 1E) rats. Figures 1F and G depict immunolabeled LH cells in fed (Fig 1F) and fasted (Fig 1G) rats. Arrow=immunolabeled cell. Bar=15 μm