
Figure 3.
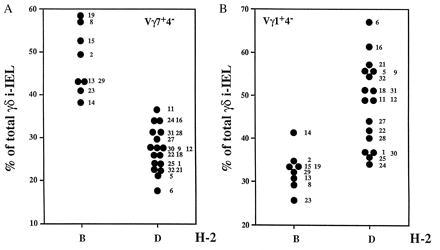
The representation of Vγ1+Vδ4− and Vγ7+Vδ4− i-IEL subsets in the BXD RI lines correlates with the MHC haplotype. i-IEL from the indicated BXD strains were isolated and stained as in Fig. 1. Data shown are the percentage of total γδ i-IEL expressing the Vγ7 chain but not the Vδ4 chain (A; Vγ7+Vδ4− cells) or the Vγ1 chain but not the Vδ4 chain (B; Vγ1+Vδ4− cells) in the BXD lines distributed as to the MHC haplotype. Each point corresponds to the mean value of two to three determinations of each BXD strain using two animals per determination. Numbers on the right of the dots denote the BXD strain number. B and D indicate the TCRγ locus inherited from the B6 and DBA/2 founder strains, respectively. The mean of the values of the Vγ7+Vδ4− in MHC B and MHC D lines are 48 ± 7.8% and 27 ± 4.9%, respectively. According to Student’s t test, those values are different with P < 0.001. The means of the values of the Vγ1+Vδ4− in MHC B and MHC D lines are 32.75 ± 4.2% and 49.1 ± 9.9%, respectively. According to Student’s t test, those values are different with a P < 0.02.