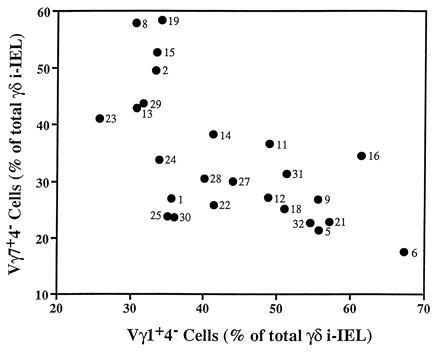
Figure 4.

Lack of strict correlation between the representations of the Vγ1+Vδ4− and the Vγ7+Vδ4− i-IEL subsets. The percentages of Vγ1+Vδ4− and Vγ7+Vδ4− i-IELs from the BXD RI lines were plotted on the x and y axes, respectively. Numbers next to the symbols are the BXD strain number.
