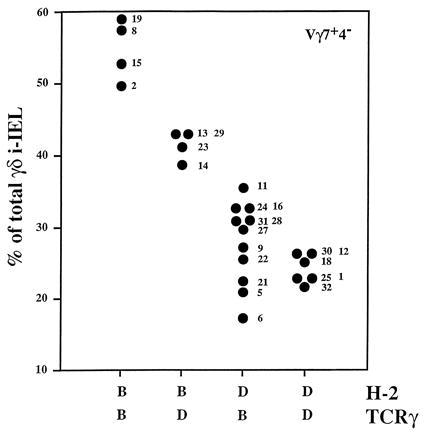
Figure 5.

Differences in the representation of the Vγ7+Vδ4− i-IEL subset in BXD lines carrying the H-2b haplotype correlate with the TCRγ allotype. The same data as in Fig. 3 were plotted. The BXD lines were distributed as to their H-2 haplotype and TCRγ allotype. The mean values of the Vγ7+Vδ4− subset in H-2b animals expressing the TCRγ B or the TCRγ D were 53.7 ± 4% and 41.2 ± 2.4%, respectively. According to Student’s t test, those values are different with a P < 0.017.
