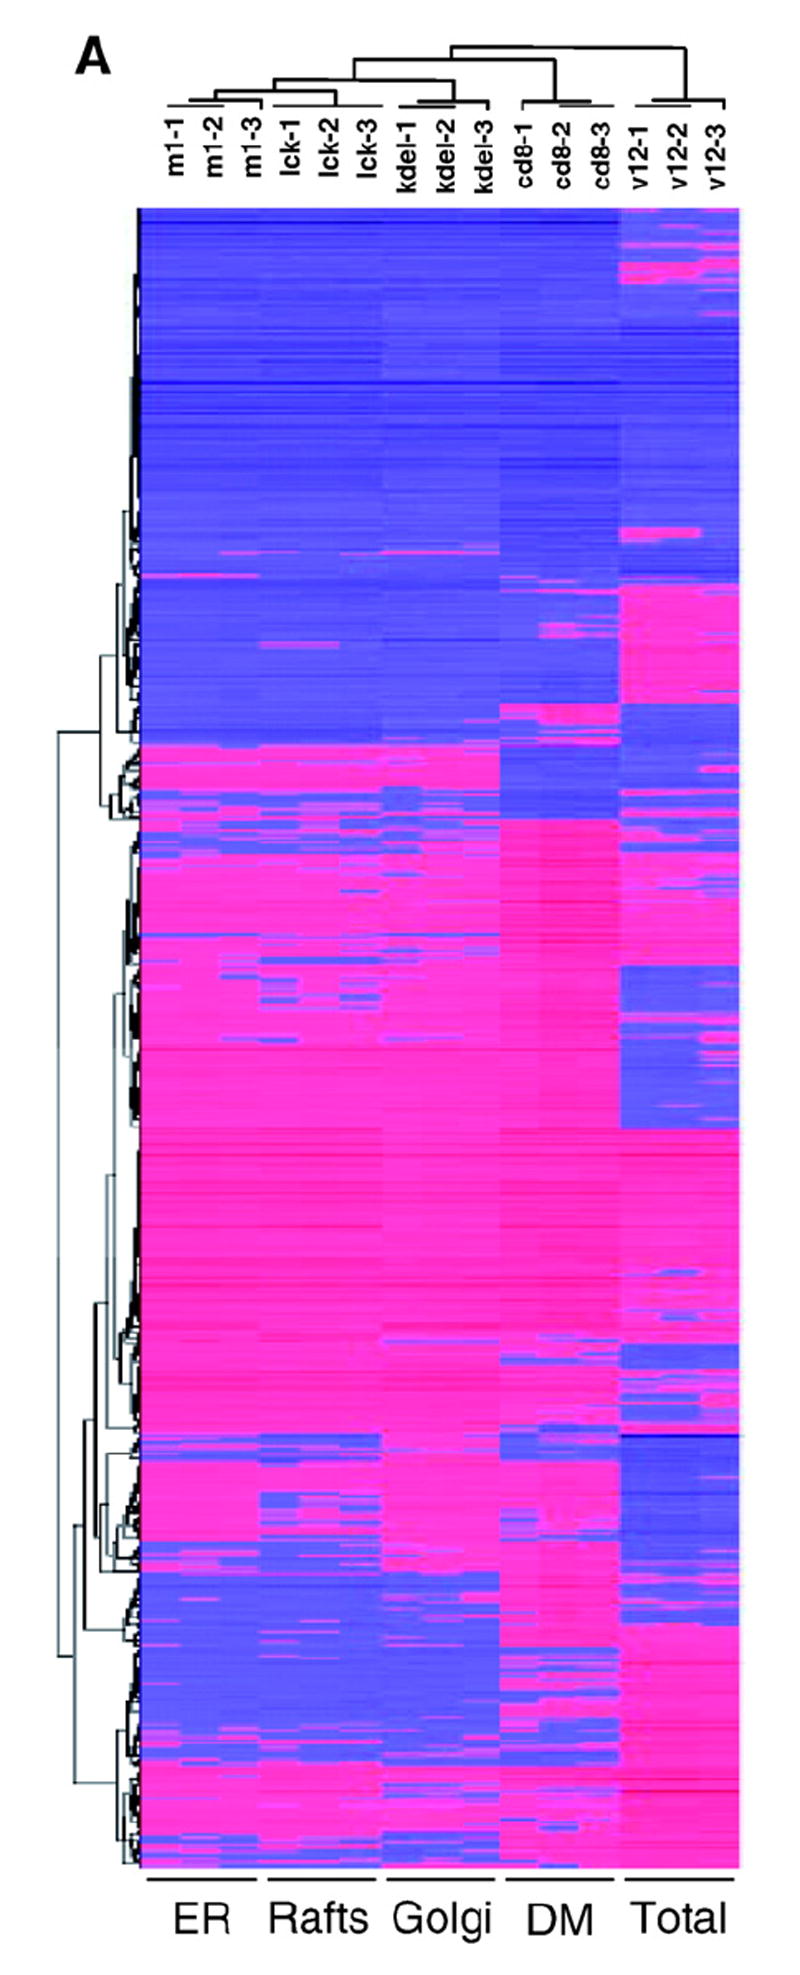
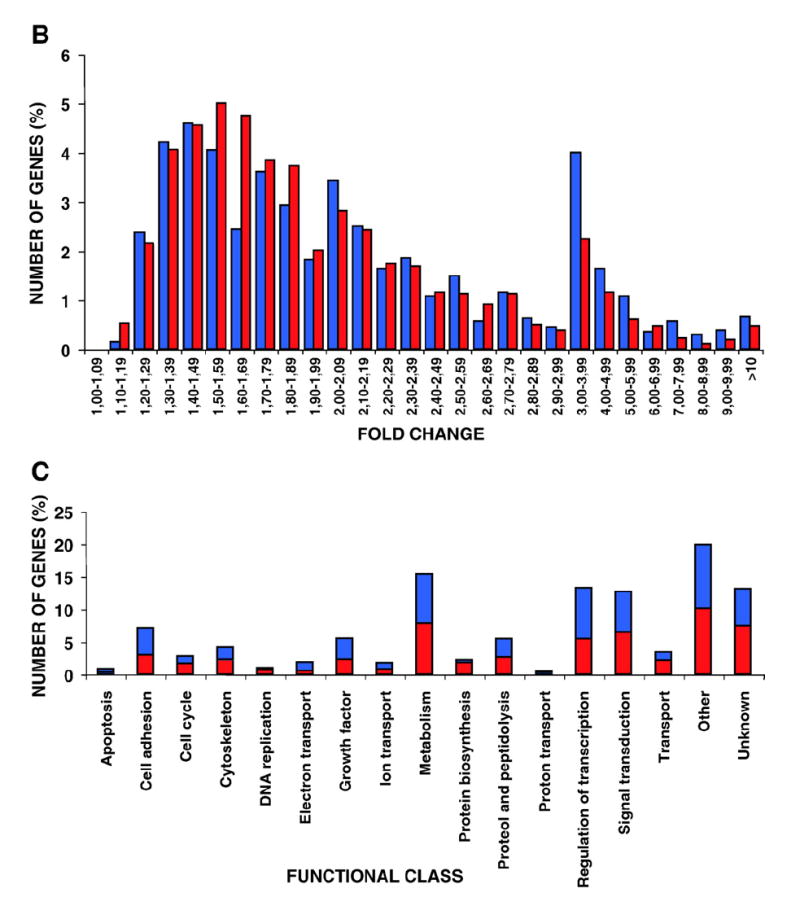
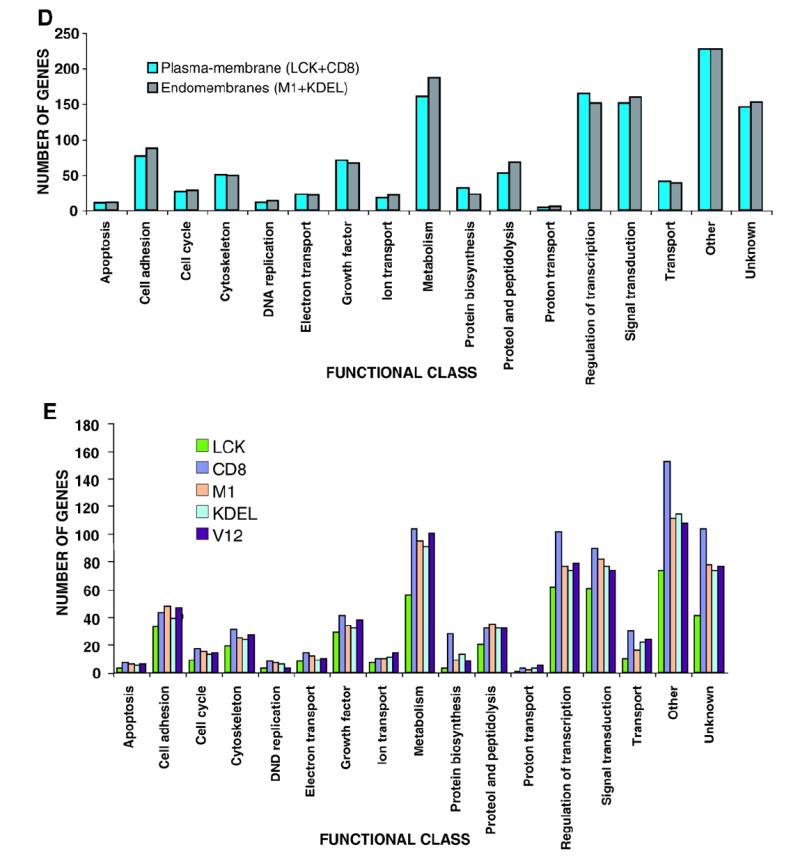
Fig. 1. Global analysis of Ras site-specific transcriptomes.


A) Hierarchical clustering of the genes regulated by site-specific Ras proteins: untagged H-RasV12 (V12) and ER- (M1), lipid raft- (LCK), DM- (CD8) and Golgi-tethered (KDEL) H- RasV12 proteins. Horizontal rows represent single gene probe sets. Vertical columns represent single microarray hybridizations. B) Histogram showing the number of up- (red) and down-regulated (blue) genes with a given expression fold change value compared to that of the parental cell line. Classifications of the genes according to general biological functions: C) Total number of genes, up- (red) and down-regulated (blue). D) Number of genes regulated from PM sublocalizations (LCK+CD8) and from endomembranes microdo-mains (M1+KDEL). E) Number of genes regulated from each of the Ras sublocalizations. (For interpretation of the references to colour in this figure legend, the reader is referred to the web version of this article.)
