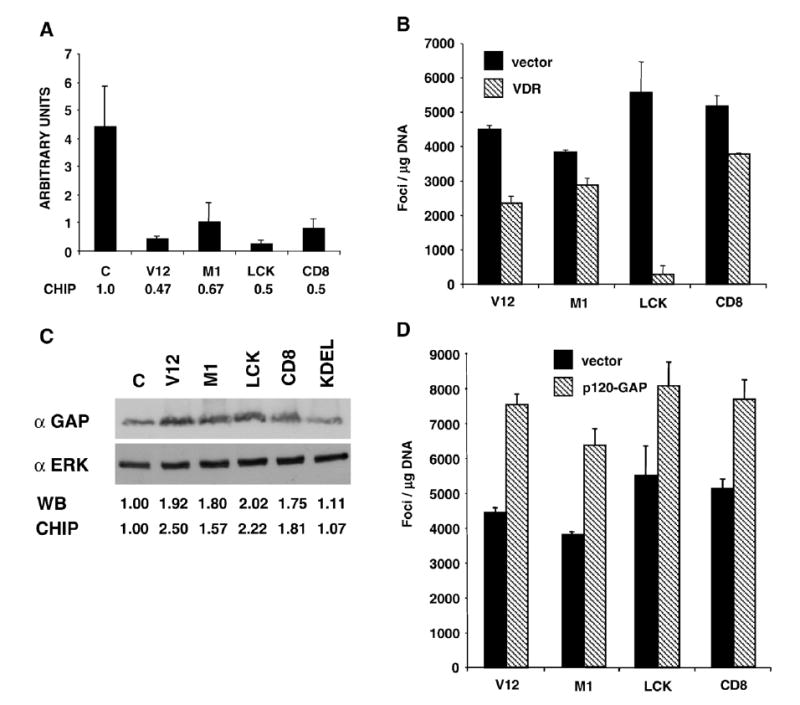
Fig. 3. Identification of participants in Ras-induced transformation.

A) RT-PCR determination of the VDR mRNA expression levels in the parental control (c) and in cell lines expressing the indicated site-specific H-RasV12 constructs. Bars show average±SEM of three independent experiments. Figures show the expression levels relative to those in the parental cell line. B) VDR overexpression impairs Ras-induced transformation. Number of transformed foci in NIH3T3 cells transfected with the Ras constructs, plus either an empty vector or with a VDR-encoding plasmid. C) p120-GAP expression is up-regulated by Ras transforming signals. P120-GAP expression levels in parental (c) and the cell lines expressing the site-specific Ras constructs. Immunoblotting for ERK is shown as a loading control. Figures show the levels of expression relative to those in the parental cell line (c), in the immunoblots and those revealed by the gene arrays. D) p120-GAP overexpression potentiates Ras-induced transformation. Number of transformed foci in NIH3T3 cells transfected with the Ras constructs plus vector or a p120-GAP expressing construct. B and E) Bars show average±SEM of five independent experiments.
