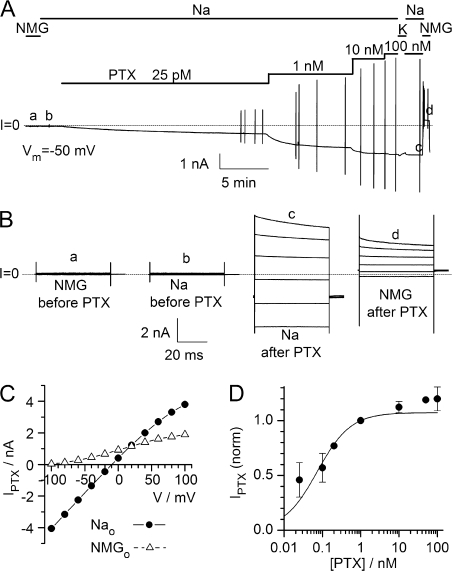
Figure 2.
Apparent affinity for palytoxin. (A) Outside-out patch from a giant fiber lobe neuron held at −50 mV. Top, horizontal bars designate bath ionic composition and the concentration of palytoxin used. Bottom, current trace. The dotted line indicates the zero current level. Palytoxin concentrations were increased when approximately steady current levels were reached at each dose. The brief vertical deflections in the current record indicate I-V measurements. (B) Membrane current traces in response to 50 ms voltage steps from −100 to 100 mV (displayed here in 40-mV increments) in external solutions containing NMG+ or Na+ before (a and b) and after complete treatment with palytoxin (c and d). (C) Average palytoxin-induced current (I after palytoxin minus I before palytoxin) during the last 5 ms of every pulse under each ionic condition plotted against the applied voltage. The relative permeability of NMG+ (PNMG/PNa) was 0.024 ± 0.002 as calculated from the large shift in reversal potential (ΔVrev = −94 ± 2 mV). (D) Normalized and averaged dose response curve for palytoxin obtained from six patches. The solid line represents a Michaelis-Menten equation fit with a K0.5 = 74 ± 21 pM.

