
Figure 1.
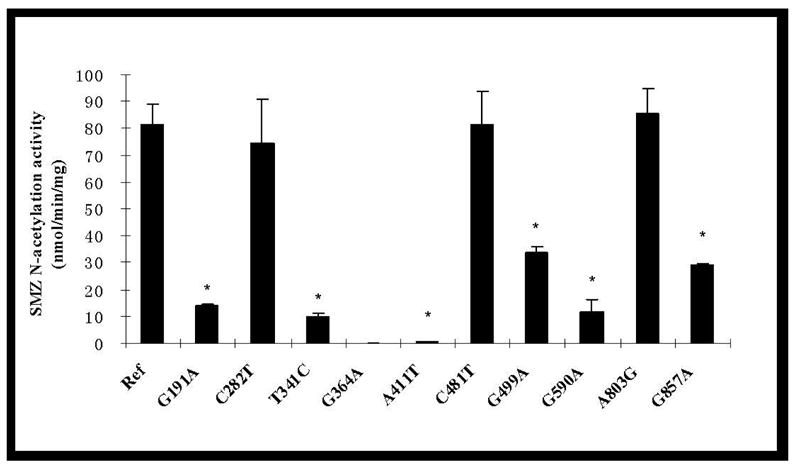
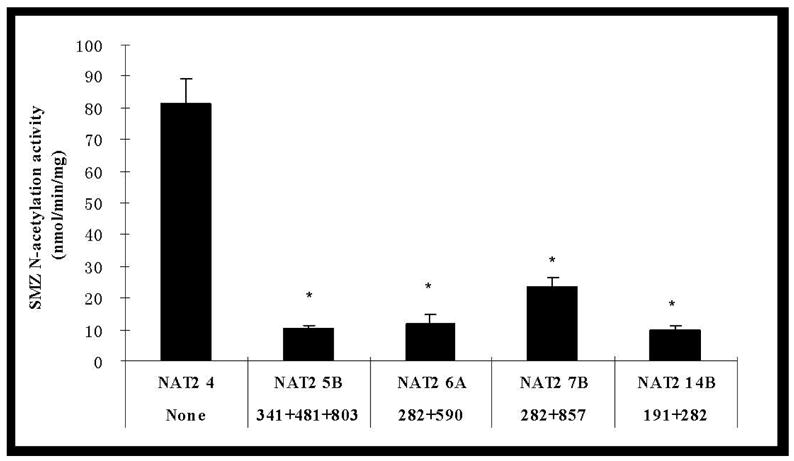
SMZ N-acetylation activities in COS-1 cells expressing NAT2 alleles possessing different SNPs (top) and haplotypes (bottom). Each error bar represents the standard deviation for transfections performed in triplicate on different days. *: Significantly (p<0.01) lower than the reference (Ref) NAT2 4. Activity in COS-1 cells transfected with NAT2 allele possessing G364A was below the detection limit (0.3 nmol/min/mg).