
Figure 3. Representative current trace of WT- and/or Δ275F-KCNQ1 expressed in CHO-K1 cells.
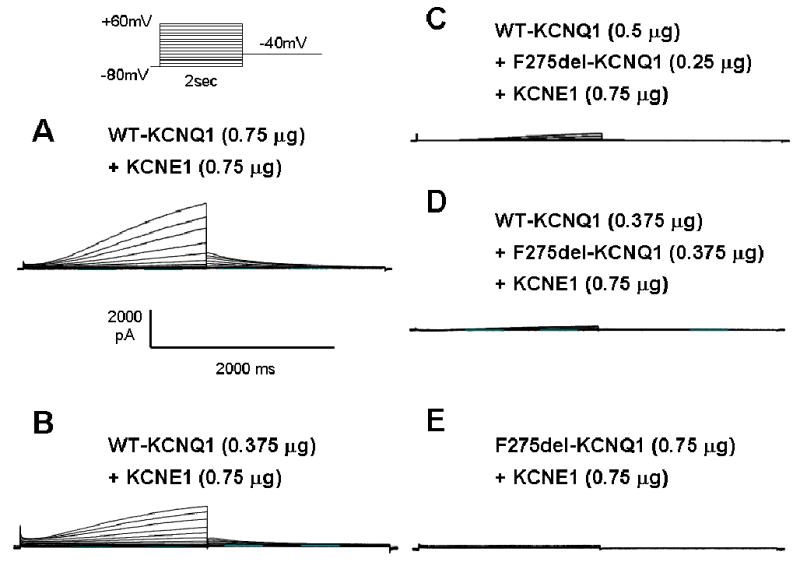
Cells of each panel were transfected as follows:
A. 0.75 μg of WT-KCNQ1 and 0.75 μg of KCNE1.
B. 0.375 μg of WT-KCNQ1 and 0.75 μg of KCNE1.
C. 0.5 μg of WT-KCNQ1, 0.25 μg of Δ275F-KCNQ1 and 0.75μg of KCNE1.
D. 0.375μg of WT-KCNQ1, 0.375 μg of Δ275F-KCNQ1 and 0.75μg of KCNE1.
E. 0.75μg of Δ275F-KCNQ1 and 0.75μg of KCNE1.
Pulse protocol is shown in the inset in the lower right.