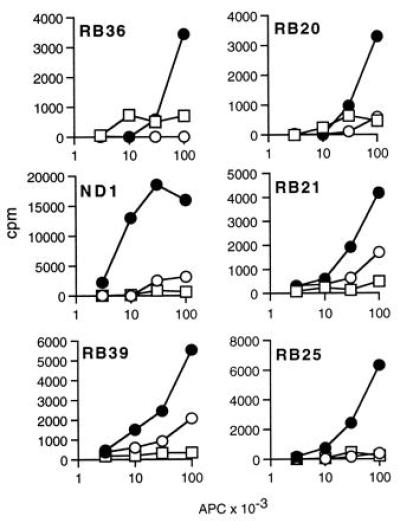
Figure 4.

Comparison of presentation by M1.DR1, M1.DR1.Ii, and DR1.B-LCL to six alloreactive T cell clones raised against M1.DR1.B7. Titrations of mitomycin-C-treated M1.DR1 (•), M1.DR1.Ii (○), or irradiated DR1.B-LCL (□) were used to stimulate alloreactive T cells (104 cells per well). The assays were undertaken as described in the legend of Fig. 3. SEM were all less than 10%.
