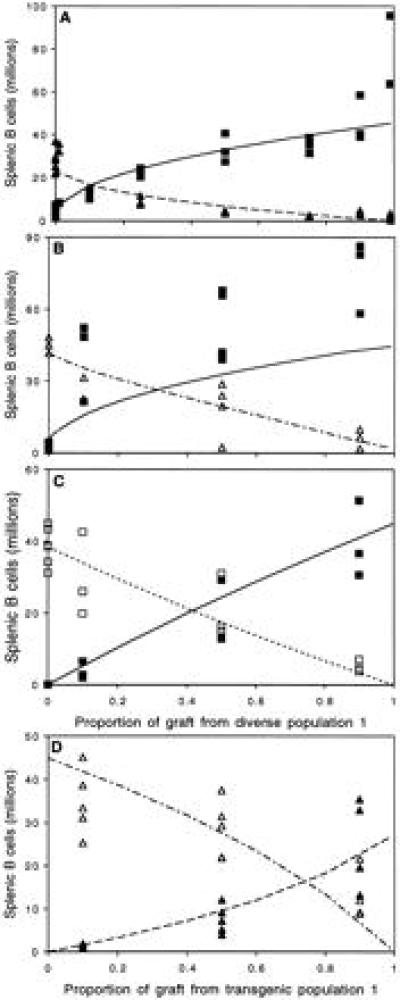
Figure 2.

Equilibrium population sizes in mice with chimeric bone marrow. Graphs compare observed (symbols) and predicted (lines) population sizes at equilibrium for four pairs of populations matched against each other. (A) Diverse 1 (▪) versus transgenic 1 (▴). (B) Diverse 1 (▪) versus transgenic 2 (▵). (C) Diverse 1 (▪) versus diverse 2 (□). (D) Transgenic 1 (▴) versus transgenic 2 (▵). Predictions were made using the model in Fig. 1 (Eqs. 1–3). Parameters used in the predictions are listed in Table 1, parameter a21 was estimated using a least-squares minimalization.
