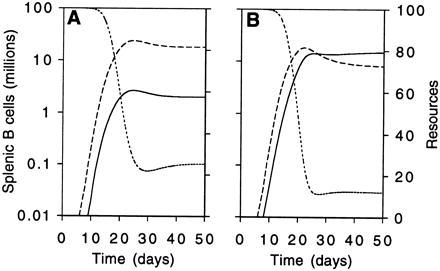
Figure 5.

Modeling resources explicitly. The adapted Tilman model also can show behavior akin to that observed. (A) Two weak competitors pitted against each other, as in Fig. 3B. (B) A weak competitor pitted against a strong competitor with the weaker population making up 90% of immigrants. As we observed (Fig. 3C), the weaker competitor initially predominates, but as resources become in short supply, the superior competitive ability of the population making up 10% of immigrants is manifested in its predominance. The model is the second set of equations in the text, X1 represented by the solid line X2 by the dashed line and resources, R, by the dotted and dashed line. Parameter values are: rB = 0.8, KB = 2.6, f = 0.5, n = 0.1, r1 = r2 = 0.85, k2 = 90, m = 0.25, a = 0.1, S = 100, g = 2; in A k1 = 90 and in B k1 = 30.
