Figure 4.


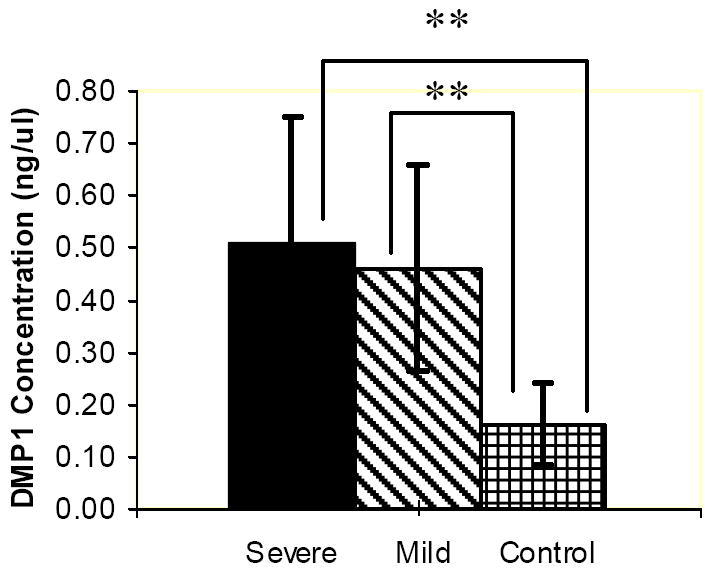
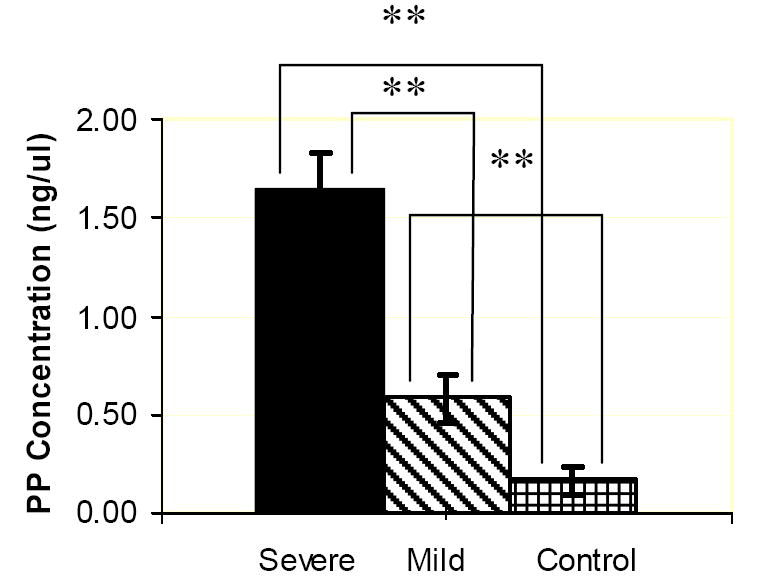
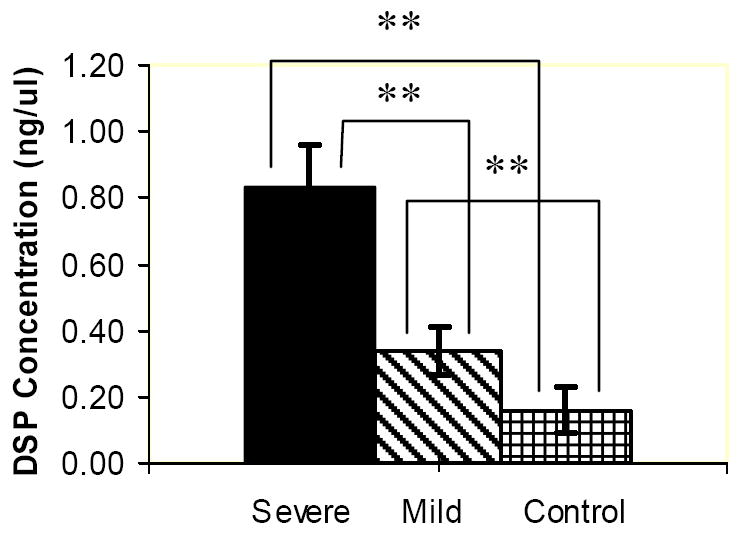
ELISA charts demonstrating the concentrations (ng/μL) of DMP1 (a) PP (b), DSP (c) proteins in the gingival crevicular fluid of control, severe and mild root resorption group subjects. Data are expressed as the mean ± SEM. ** P < 0.05.


ELISA charts demonstrating the concentrations (ng/μL) of DMP1 (a) PP (b), DSP (c) proteins in the gingival crevicular fluid of control, severe and mild root resorption group subjects. Data are expressed as the mean ± SEM. ** P < 0.05.