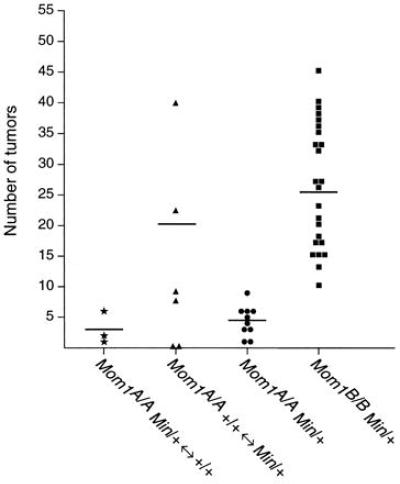
Figure 3.

Normalized tumor multiplicity in Mom1 chimeras. Each symbol indicates the tumor number in a single animal. ★, Mom1B6/B6 +/+ ↔ Mom1AKR/AKR Min/+ mice; ▴, Mom1AKR/AKR +/+ ↔ Mom1B6/B6 Min/+ mice; •, a control population of age-matched Mom1AKR/AKR Min/+ mice; ▪, a control population of Mom1B6/B6 Min/+ mice. All mice were killed at 80 days of age. The horizontal bars indicate the positions of the means.
