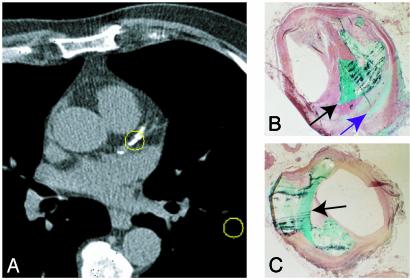
Fig. 1.
(A) Calcification (center circled region) in the proximal left anterior descending coronary artery shown on an electron beam computed tomography transverse section. Consecutive high-resolution non-contrast-enhanced computed tomography images are acquired from the top to the bottom of the heart to visualize arterial calcification. Regions of high computed tomography density representing calcium deposits are summed, and a calcium score is derived. This score is then used to ascertain the risk of future cardiac events. (B and C) Human coronary artery sections prepared by using undecalcified methylmethacrylate embedding and sectioning procedures and stained with Goldner–Masson trichrome stain. Two distinct patterns of calcification are evident: large focal mineral deposition (turquoise, black arrow in B and C) and a fine speckled pattern (purple arrow in B).

