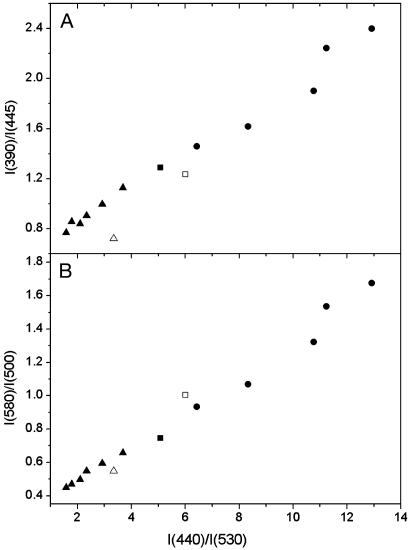
Fig. 4.
Correlation of the ratiometric response of probe F4N1 to the dipole potential with that of di-8-ANEPPS. Intensity ratios for F4N1 at the excitation spectrum edges, I390/I445 (A), and at the N* and T* maxima of emission spectrum, I580/I500 (B), are represented as a function of the excitation ratio I440/I530 for di-8-ANEPPS. The dipole potential is modified in EYPC vesicles (▪) by the addition of phloretin (▴) or 6-KC (•) at 20°C and also by the substitution of DMPC (□) by DTPC (▵) at 38°C. Di-8-ANEPPS excitation spectra were recorded at an emission wavelength of 645 nm.

