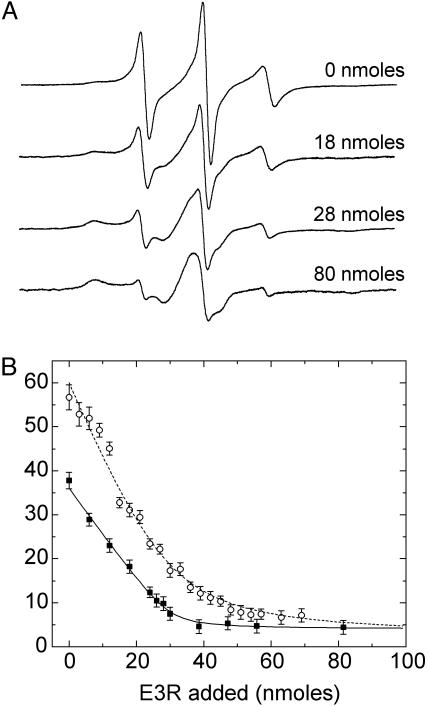
Fig. 5.
(A) X-band EPR spectra showing the titration of the spin-labeled mutant V10R1 in mixed micelles with 0, 18, 28, and 80 nmol of E3R. The spectra are 100-G scans. (B) Filled squares represent the fraction of the Ton box in the undocked state as a function of the mol percentage of E3R. The open circles represent the percentage in the undocked state for the V10R1 sample that had an equal molar amount of vitamin B12 added at the beginning of the titration. The percentage of the undocked Ton box was estimated by spectral subtraction and assumes that there are only two motional components giving rise to the EPR spectrum. The solid line represents a fit to the data assuming a 1:1 binding of E3R to BtuB. The apparent 1:1 association constant was estimated to be at least 2 × 10⁶ or greater, but it is not well determined because of the high protein and E3R concentrations used in this titration. The data obtained in the presence of vitamin B12 were also fit assuming a 1:1 binding (dashed line), but this simple model does not account for the competition occurring between the two ligands. The titration experiments were performed on an ≈100 μM BtuB sample in a mixed micelle environment with volumes of 100 μM E3R solution added stepwise.

